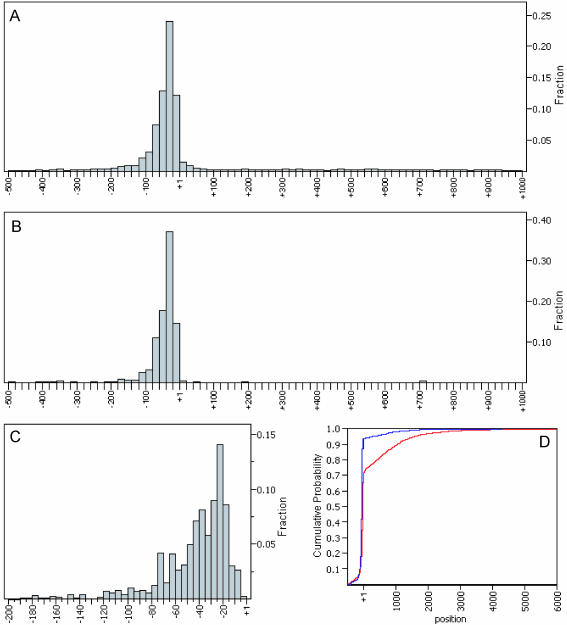
Figure 2.
5′ SAGE tag distribution around the ORF start codon. (A) Distribution of all 8194 unitags from 500 bp upstream of ATG to 1000 bp downstream of ATG. (B) Distribution of all 1165 multiple occurrence unitags from 500 bp upstream of ATG to 1000 bp downstream of ATG. (C) Zoom-in view of tag distribution shown in (B) within 200 bp putative 5′-UTR region. (D) Cumulative distribution function (CDF) plots of all unitags (red) and multiple occurrence unitags (blue).

