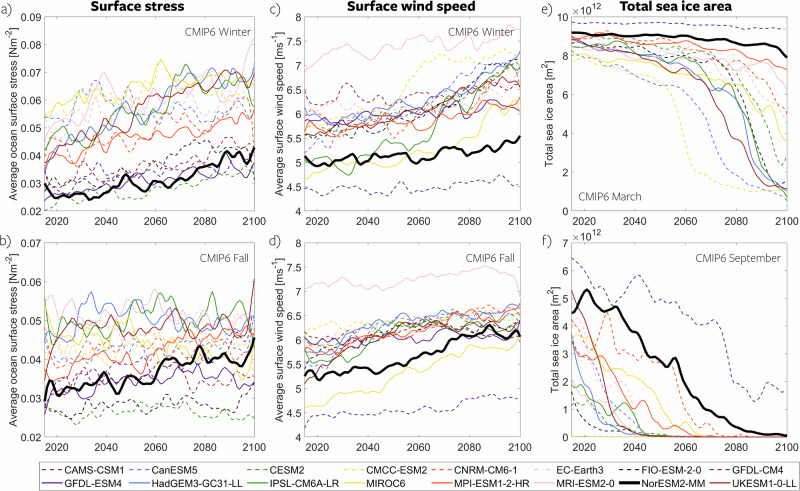
Fig. 3. Time series of future Arctic Ocean surface stress, wind speed, and ice area.
Spaghetti plots illustrating model time series from all CMIP6 models, depicting the future change in Arctic ocean surface stress (a, b), surface wind speed (c, d), and total sea ice area (e, f) for winter (top row) and fall (bottom row). The thick black lines represent the NorESM2-MM model, serving as a case study for more detailed analysis. Source data are provided as a Source Data file.

