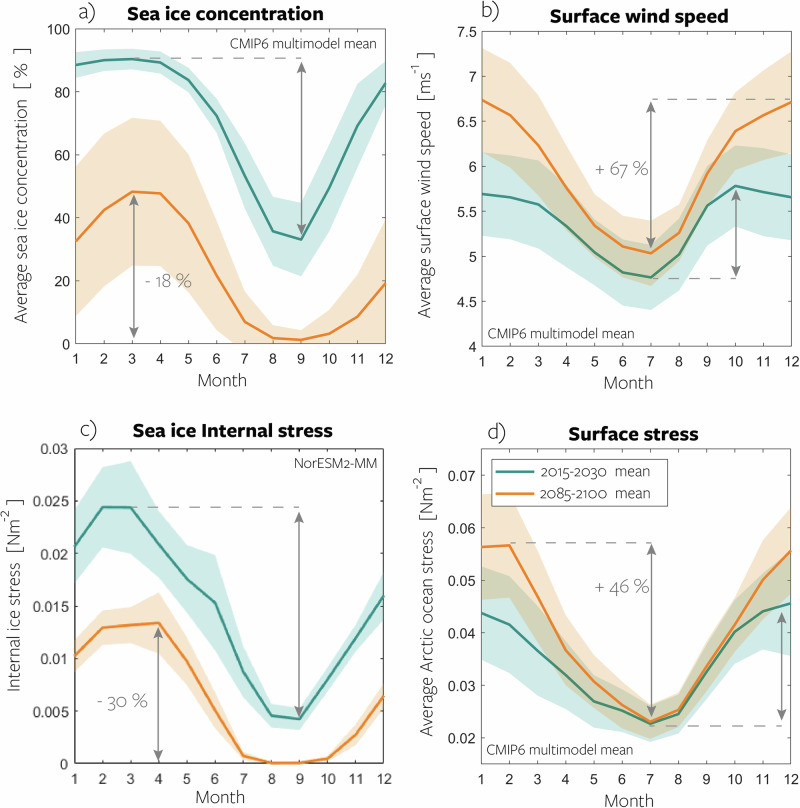
Fig. 5. Seasonal change at the Arctic Ocean’s surface.
Monthly averages of Arctic Ocean properties in the early 21st century (teal lines), mid-21st century (dashed orange lines), and late 21st century (solid orange lines) based on the CMIP6 multimodel mean. Panels include a sea ice concentration, b surface wind speed, c sea ice internal stress, and d surface stress. Shading in panels a–d represents the standard deviation of the CMIP6 model spread, while panel c exclusively shows NorESM2-MM and the shading represents the interannual spread for each month. Arrows indicate the timing and amplitude of the seasonal maximum and minimum, and percentages depict the change in seasonal amplitude from 2015–2030 to 2085–2100. Source data are provided as a Source Data file.

