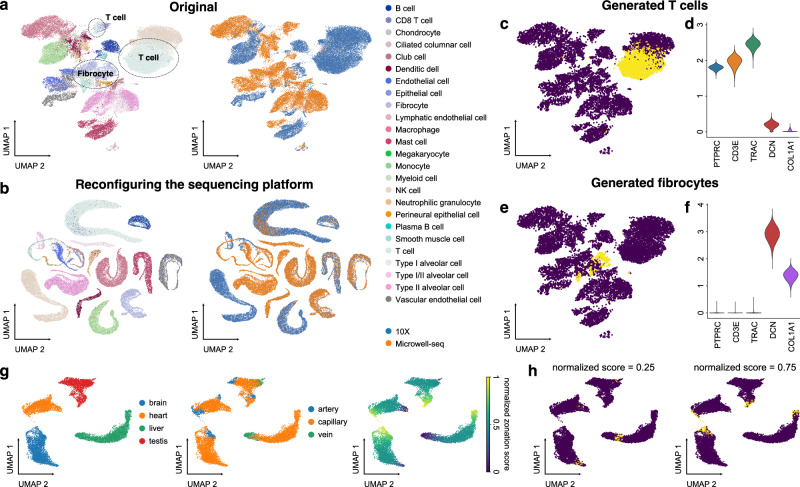
Fig. 2. In silico reconfiguration with UniCoord generates cells with designated features.
a UMAP plots showing the original hECA lung cells colored by cell types (left) or sequencing platforms (right). b UMAP plots showing the generated hECA lung cells with the sequencing platform reconfigured into “10X”, colored by cell types (left) and original sequencing platforms (right). c The UMAP plot of original cells (blue) and cells with the cell type reconfigured into T cells (yellow). d Expression levels of T-cell and fibrocyte markers in cells with the cell type reconfigured into T cells. e The UMAP plot of original cells (blue) and cells with the cell type reconfigured into fibrocytes (yellow). f Expression levels of T-cell and fibrocyte markers in cells with the cell type reconfigured into fibrocytes. g Vascular endothelial cells from four mouse organs, colored by tissues (left), vessel types (middle), or normalized artery-capillary-vein zonation scores (right). The zonation scores were normalized to be between 0 and 1. h UMAP plots of original cells (blue) and cells with zonation scores reconfigured into different values (yellow). For both models, all genes in the dataset were adopted to perform the experiments, and the number of unsupervised latent dimensions was set as 50. a, b All genes were used for visualization. c, e, g, h Highly variable genes (HVGs) were used for visualization. c, e, h For each generated cell, we calculated its nearest neighbor in the original dataset for visualization.

