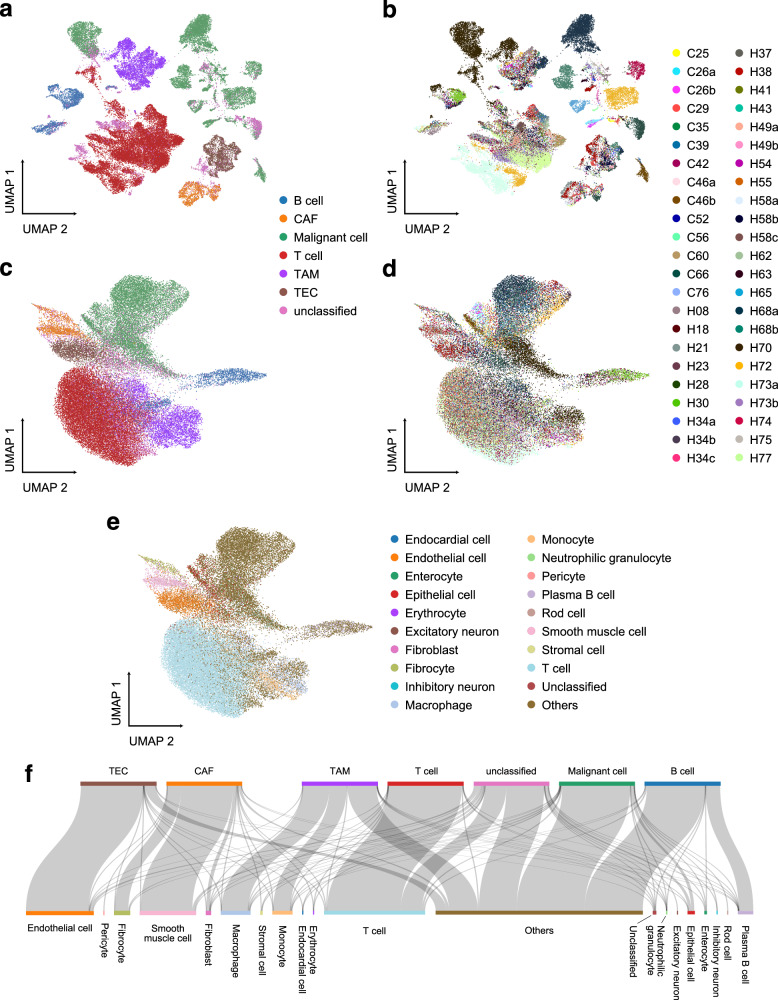
Fig. 4. Analyze HCC data using the UniCoord model pretrained by hECA data.
a, b The UMAP plot showing the landscape of the HCC dataset, represented by PCA. Cells are colored by cell types (a) or sample IDs (b). c–e The UMAP plot showing the landscape of the HCC dataset, represented by the pretrained UniCoord model. Cells are colored by cell types (c), sample IDs (d), and UniCoord-predicted cell types (e). f The relations between original labels (top) and cell types predicted by UniCoord (bottom). Protein coding genes in the dataset were adopted to perform the experiments. All genes were used for visualization all UMAP plots.

