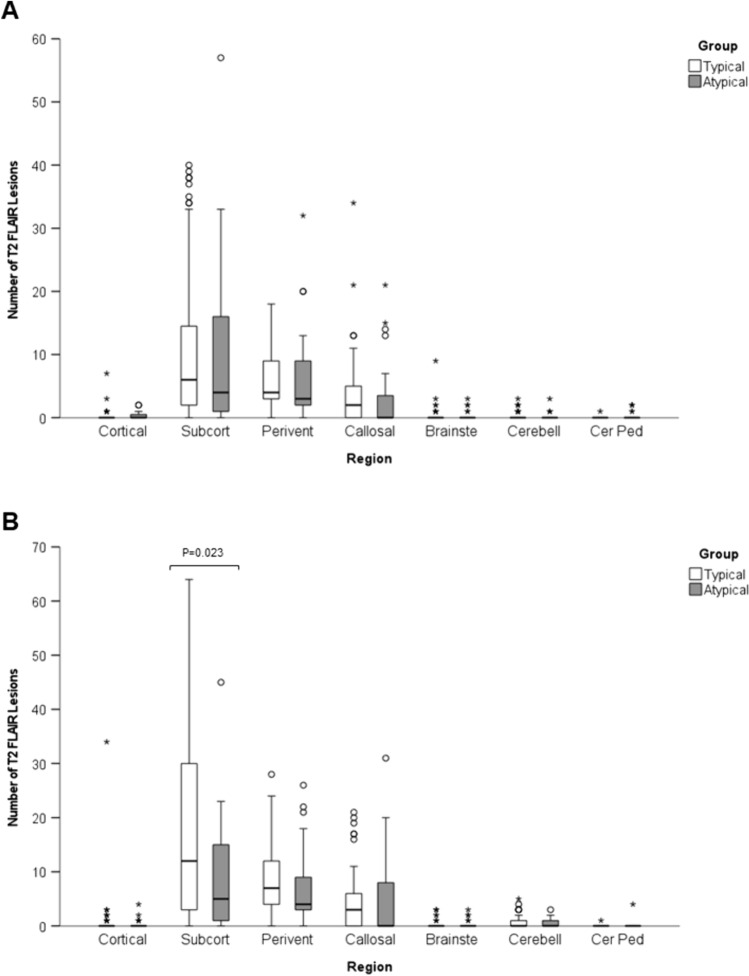
Fig. 5.
Box and whisker plots of distribution of T2/FLAIR lesions at presentation (A) and last follow up (B). Significant differences between atypical and typical MS cases are indicated. Central bar shows median, box shows interquartile range and whiskers indicate range. Outliers indicated by circles; extreme outliers indicated by asterisks. Subcort subcortical; Perivent periventricular; Brainste brainstem; Cerebell Cerebellar; Cer Ped cerebellar peduncle

