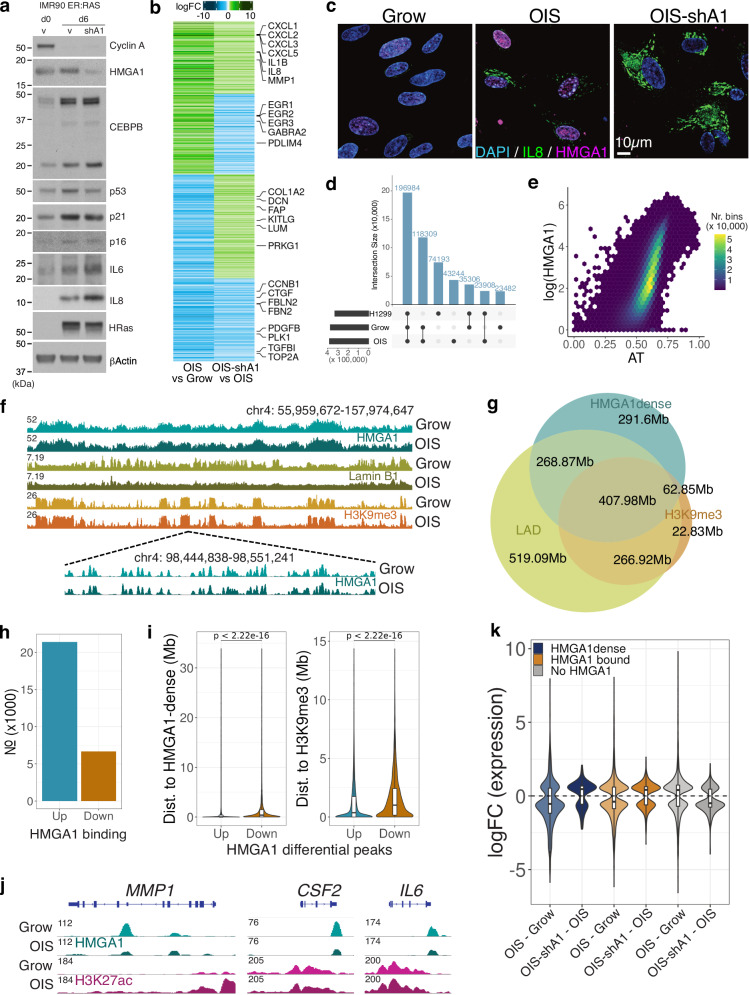
Fig. 1. The HMGA1 effect on transcription and genome-wide binding distribution in proliferating and OIS cells.
a Protein-level changes of key senescence genes in proliferating IMR90 (Grow; day 0), OIS (day 6) with and without shHMGA1 (shA1)—three replicates per condition. Source data are provided as a Source Data file. b Gene expression log-fold changes (logFC) in OIS compared to Grow and OIS-shA1 compared to OIS of the genes differentially expressed in both comparisons, clustered by the direction of the change. c Immunofluorescence imaging of Grow, OIS and OIS-shA1 stained for DAPI (nuclear; blue), IL-8 (green), and HMGA1 (magenta) cells (n = 2 per condition, quantification—Supplementary Fig. 1f, Source data are provided as a Source Data file). d Overlap between HMGA1 consensus peaks in the IMR90 Grow and OIS and H1299 cells. e Correlation between AT% and average (log) HMGA1 signal in 200 kb bins. f Top: ChIP-seq normalised signal tracks of HMGA1, H3K9me3 and Lamin B1 in the Grow and OIS conditions (IGV browser); Bottom: close-up view of the HMGA1 peaks in a smaller genomic region. g Overlaps (genomic area covered in Mb) between HMGA1-dense regions, Lamin-associated domains (LADs), and H3K9me3 peaks in growing IMR90 cells. h Number of HMGA1 binding changes in OIS compared to Grow cells (Up—increased, Down—decreased). i Properties of the n = 16,420 peaks with increased (Up) and n = 4060 peaks with decreased (Down) HMGA1 binding from h: distance to the nearest HMGA1-dense region (left) and the nearest H3K9me3 peak (right). j ChIP-seq normalised signal tracks of HMGA1 and H3K27ac over representative genes with decreased HMGA1 on their gene body: MMP1, CSF2, IL6. k Distribution of log-fold changes in OIS compared to Grow and OIS-shA1 compared to OIS of the genes DE in each respective comparison classified as: 1) overlapping HMGA1-dense regions (n = 893 and 218 genes), 2) with any HMGA1 binding (n = 2580 and 518 including genes in HMGA1-dense regions), and 3) not bound by HMGA1 at all (n = 2756 and 445 genes), respectively. j, k Box plot centre line represents the median, the bounds correspond to the 0.25 and 0.75 quantiles, the whiskers represent the 0.1 and 0.9 quantiles. Significance testing was performed using two-sided Wilcoxon tests.

