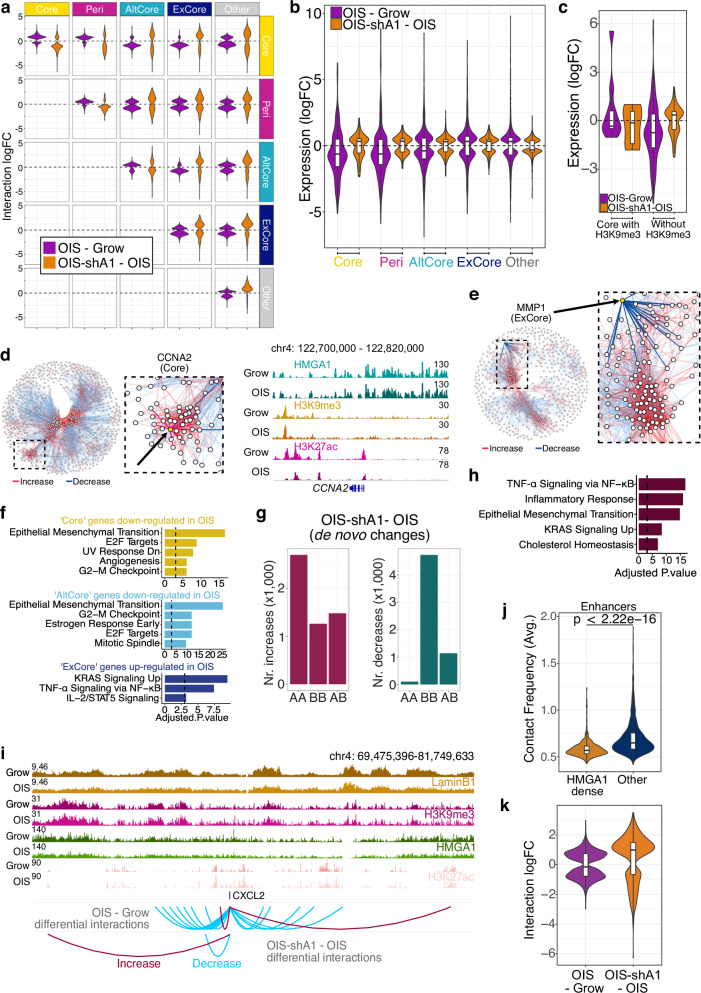
Fig. 4. The effects of HMGA1 loss on the chromatin interactions network and gene expression.
a The log-fold changes of the differential interactions between the regions in each pair of classes in OIS compared to Grow (purple) and OIS-shA1 compared to OIS (orange). b The distributions of the gene expression log-fold changes in the OIS compared to Grow and OIS-shA1 compared to OIS comparisons of the genes within the five classes which are also DE in their respective comparisons (n = 253 and 130 genes in Core, n = 225 and 98 genes in Peri, n = 1015 and 398 genes in AltCore, n = 1088 and 418 genes in ExCore, and n = 4333 and 1411 genes in Other). c Gene expression log-fold changes in OIS compared to Grow and OIS-shA1 compared to OIS of the respective DE genes within ‘Core’ regions with (n = 9 and 6 genes) and without H3K9me3 (n = 208 and 101 genes). d The position of the Core CCNA2 gene (left) in the networks of differential interactions on chromosomes 4 in OIS compared to Grow and the ChIP-seq signal of HMGA1, H3K9me3 and H3K27ac at the CCNA2 locus (right). e The position of the ExCore gene MMP1 in the chromosome 11 network of differential interactions in OIS—Grow. f The top MSigDB Hallmarks gene sets enriched in the genes down-regulated (in OIS compared to Grow) and overlapping ‘Core’ and ‘AltCore’ regions, and the genes up-regulated (in OIS compared to Grow) and overlapping the ‘ExCore’ regions. g The increased (left) and decreased (right) de novo interactions in OIS-shA1 compared to OIS, according to the A- or B- compartment assignments of the interacting regions. h Gene set enrichment analysis against the MSigDB Hallmarks of the genes DE in OIS-shA1 compared to OIS and involved in the de novo increased interactions in the same comparison. P-values derived with EnrichR—Fischer’s exact test adjusted for multiple comparisons with Benjamini-Hochberg. i ChIP-seq normalised signal tracks of Grow and OIS Lamin B1, H3K9me3, HMGA1, and H3K27ac of the CXCL2 gene locus and the regions involved in increased (red) and decreased (blue) interactions in the OIS compared to Grow and OIS-shA1 compared to OIS, respectively. j The average contact frequencies in OIS of the enhancers within HMGA1-dense regions (n = 833 bins overlapping these enhancers) compared to other enhancers (n = 2610 bins overlapping these enhancers). k The interaction log-fold changes in OIS compared to Grow and OIS-shA1 compared to OIS of only the enhancers within HMGA1-dense regions (n = 833 bins overlapping these enhancers). b, c, j, k Box plot centre line represents the median, the bounds correspond to the 0.25 and 0.75 quantiles, the whiskers represent the 0.1 and 0.9 quantiles. P-values derived from two-sided Wilcoxon testing.

