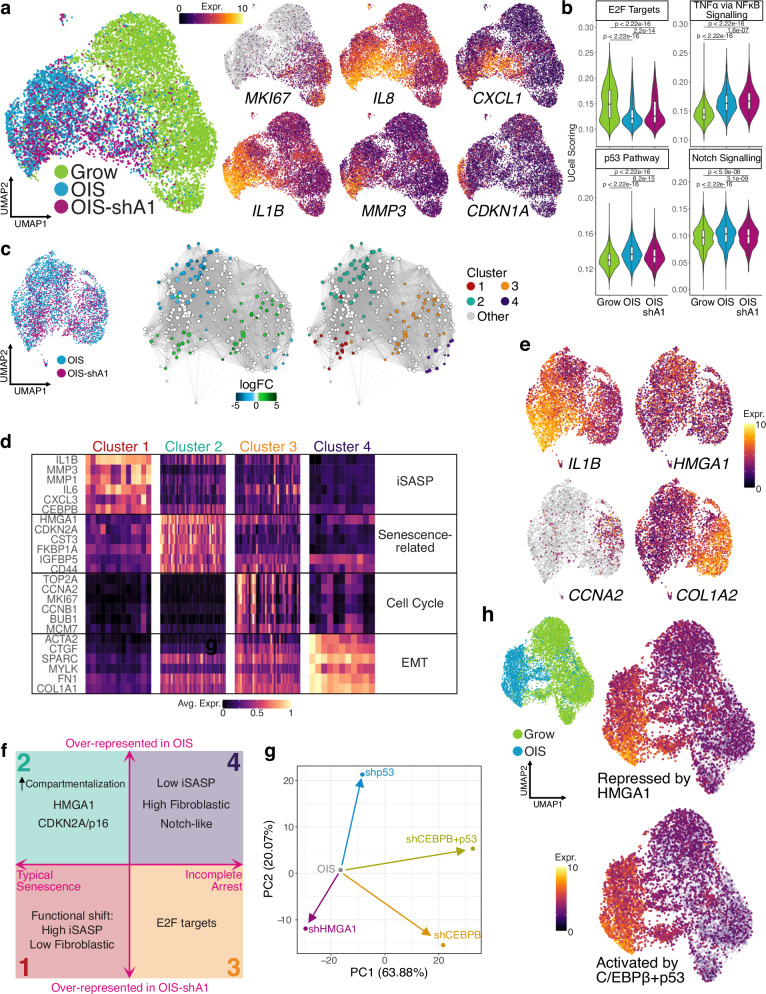
Fig. 5. Senescence transcriptional programmes at single-cell level.
a Single-cell UMAP projection of Grow, OIS and OIS-shA1 cells (coloured by condition but each representing two replicates), highlighting key senescence genes: MKI67, IL8, CXCL1, IL1B, MMP3, and CDKN1A; expression values (log-transformed) were scaled to be between 0 and 10 for visualisation, with grey representing no expression detected. b Distribution of UCell single-cell scores for selected MSigDB Hallmarks gene sets in n = 6165 Grow, n = 2828 OIS, and n = 2073 OIS-shA1 cells; P-values derived from two-sided Wilcoxon testing. Box plot centre line represents the median, the bounds correspond to the 0.25 and 0.75 quantiles, the whiskers represent the 0.1 and 0.9 quantiles. c UMAP projection of the OIS and OIS-shA1 conditions only for Milo testing of cell neighbourhoods and clustering based on the log-fold changes between OIS and OIS-shA1. d Representative markers of the four Milo clusters of differential expression between OIS and OIS-shA1 cells at single-cell level, with expression values scaled between 0 and 1 and averaged over the cell neighbourhoods in each cluster from c. e Representative markers for clusters 1–4 coloured by scaled expression values on the UMAP projection of OIS and OIS-shA1 cells. f Schematic representation of the features of the four clusters of senescent cells identified using overrepresentation analysis, highlighting the clusters over-represented in OIS (2 and 4) and in OIS-shA1 (1 and 3), respectively. Although inflammatory SASP (iSASP) and p16 have been collectively considered senescence hallmarks, they represent distinct types of senescence at the single-cell level. Clusters 3 and 4 express cell-cycle genes and Cluster 4 resembles the previously described NOTCH-related ‘early phase senescence’ with augmented fibroblastic features33,34. g Dimensionality reduction (PCA) of the log-fold changes of OIS cells (bulk RNA-seq) in response to shHMGA1, shCEBPB, shp53 and double knock-down of p53 and CEBPB. h UMAP projection of the Grow and OIS cells, coloured by UCell scoring of the gene signatures of the genes activated in OIS and up-regulated by shA1 (repressed by HMGA1, top) and down-regulated by the double knock-down of p53 and CEBPB (activated by p53 + CEBPB, bottom).

