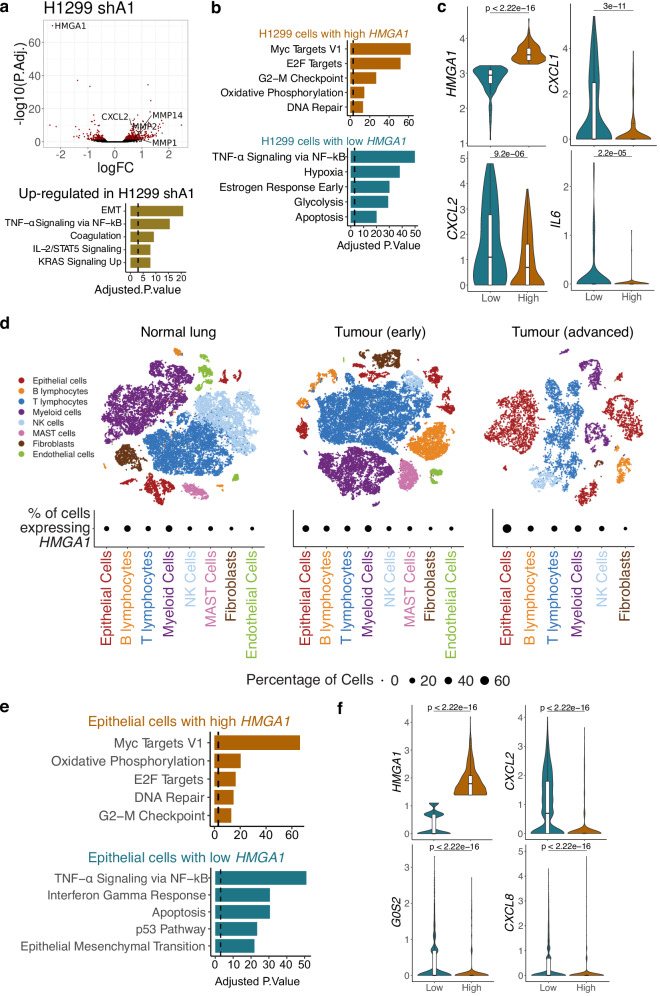
Fig. 6. The effect of HMGA1 on the transcriptome of lung adenocarcinoma.
a Expression changes in H1299 cells in response to shHMGA1, highlighting differentially expressed genes (top) and gene enrichment analysis against the MSigDB Hallmarks of the genes up-regulated by shHMGA1 in H1299 cells (bottom). Expression P-values derived from edgeR differential expression testing and adjusted for multiple testing using Benjamini-Hochberg correction. b Gene enrichment analysis of the markers of H1299 cells with high and low HMGA1 expression from a single-cell expression dataset of H1299 cells (see Methods). c Distribution of the expression at single-cell level of the representative markers of the same H1299 cells from b with low (n = 131) and high (n = 187) expression of HMGA1, respectively. d Cell populations of normal lung, early and advanced lung adenocarcinoma and the percentage of cells expressing HMGA1. e Top enrichment results (MSigDB Hallmarks) for the gene markers of epithelial cells in the advanced tumour with high (top) and low (bottom) HMGA1 expression. f Expression distribution of representative genes for the same cells from e, with high (n = 861) and low (n = 3084) HMGA1 expression. a, b, e Gene enrichment P values calculated with the EnrichR software using Fischer’s exact test and adjusted for multiple testing with Benjamini-Hochberg. c, f P values derived from two-sided Wilcoxon testing. Box plot centre line represents the median, the bounds correspond to the 0.25 and 0.75 quantiles, the whiskers represent the 0.1 and 0.9 quantiles.

