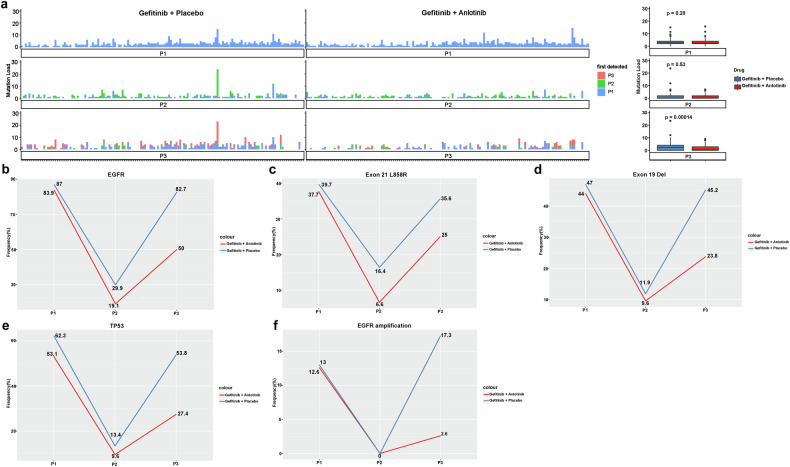
Fig. 4.
Dual inhibition of VEGF and EGFR signaling pathways reduces the tumor mutational load and the frequencies of key driver gene mutations. a Tumor mutational load in individual patients at baseline (P1), the first posttreatment efficacy evaluation (P2) and disease progression (P3) (left panel). Each column represents one patient in efficacy evaluable patients. Boxplots of tumor mutational load in patients in the gefitinib plus anlotinib group and the gefitinib plus placebo group are shown on the right. Temporal changes in the rates of mutated EGFR gene b, EGFR Exon 21 L858R c and Exon 19 Del d, mutated TP53 gene e and copy number variations (amplification) f in the two groups from baseline to disease progression

