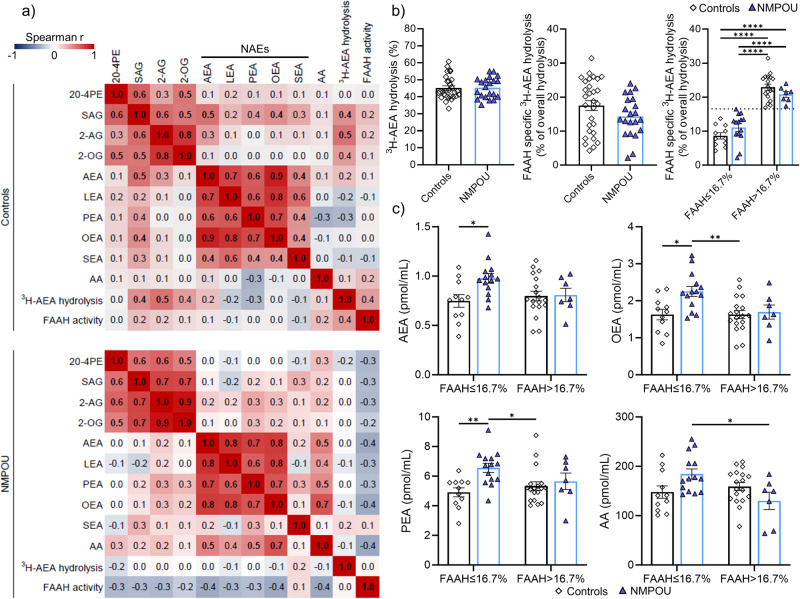
Fig. 3. Correlation patterns of plasma lipids and analysis of general and FAAH specific hydrolysis of 3H-AEA in whole blood samples of controls and NMPOU.
a Spearman correlation heatmaps of quantified lipid levels in plasma and general, as well as FAAH specific hydrolysis (FAAH activity, see b) of 3H-AEA in lysed whole blood samples. For each pairwise correlation the Spearman r is shown in the heatmaps. The color-coding legend of the Spearman r values is presented and is reaching from −1 (strong negative correlation, blue) over 0 (no correlation, white) to 1 (strong positive correlation, red). Significant correlations (p < 0.05) are highlighted with bold Spearman r values. b General and FAAH mediated hydrolysis (FAAH activity) of 3H-AEA in whole blood samples, as well as whole blood FAAH activity of participants sorted into groups with high and low FAAH activity based on median split of all participants (median FAAH activity 16.7%). c Selected graphs of quantified plasma N-acylethanolamines and AA levels sorted by FAAH activity quantified in whole blood (see b, FAAH specific 3H-AEA hydrolysis). b, c Data are presented as scatter dot plot with bar showing mean ± SEM. Each dot represents the quantified value of one participant. For statistical analysis a two-tailed, unpaired t-test was performed with a p-value < 0.05 considered to indicate a significant difference between the two compared groups. Significant p-values marked with p-values < 0.05*, p-values < 0.01**, p-values < 0.001***, p-values < 0.001***. 20:4PE 1,2-diarachidonoyl-sn-glycero-3-phosphoethanolamine, 2-AG 2-arachidonoylglycerol, 2-OG 2-oleoylglycerol, AA arachidonic acid, AEA arachidonoyl ethanolamide, FAAH fatty-acid amide hydrolase, LEA linoleoyl ethanolamide, NAEs N-acylethanolamines, OEA oleoylethanolamide, PEA palmitoylethanolamide, SAG 1-Stearoyl-2-arachidonoyl-sn-glycerol, SEA stearoyl ethanolamide.

