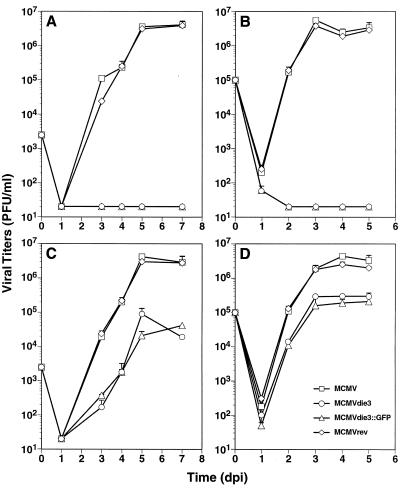
FIG. 4.
Growth curve analysis of the MCMV ie3 mutants. NIH 3T3 (A, B) or NIH 3T3-Bam25 (C, D) cells were infected at an MOI of 0.05 (A, C) or 2 PFU per cell (B, D) with the parental MCMV, MCMVdie3, and MCMVdie3::GFP and the revertant MCMVrev. At the indicated time points after infection (days p.i. [dpi]), supernatants from the infected cultures were harvested and titered on monolayers of NIH 3T3-Bam25 cells. The limit of detection was 20 PFU/ml. Error bars indicate the standard deviation from three separate cultures.

