
Fig. 4. Ranks of the 7mer cognate epitope (Table 1) in 1 million random sequences using training sets of array peptides in which sequences similar to the cognate sequence have been removed.
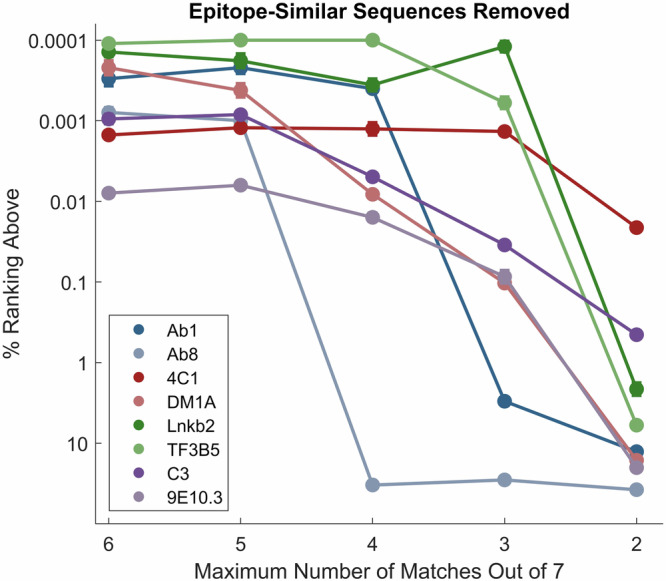
The Y axis is the percent rank, with 0.0001% signifying rank 1 in a million. The X axis is the maximum number of amino acids that were in common with the epitope in the peptide array sequences used for training. The points and error bars (standard error of the mean) represent the average and standard error of 5 randomly chosen sets of 1 million comparison peptides each and 12 randomly initiated models. In most cases, the error bar is too small to see in the plot. See Supplementary Tables S6 and S7 for tabular values.