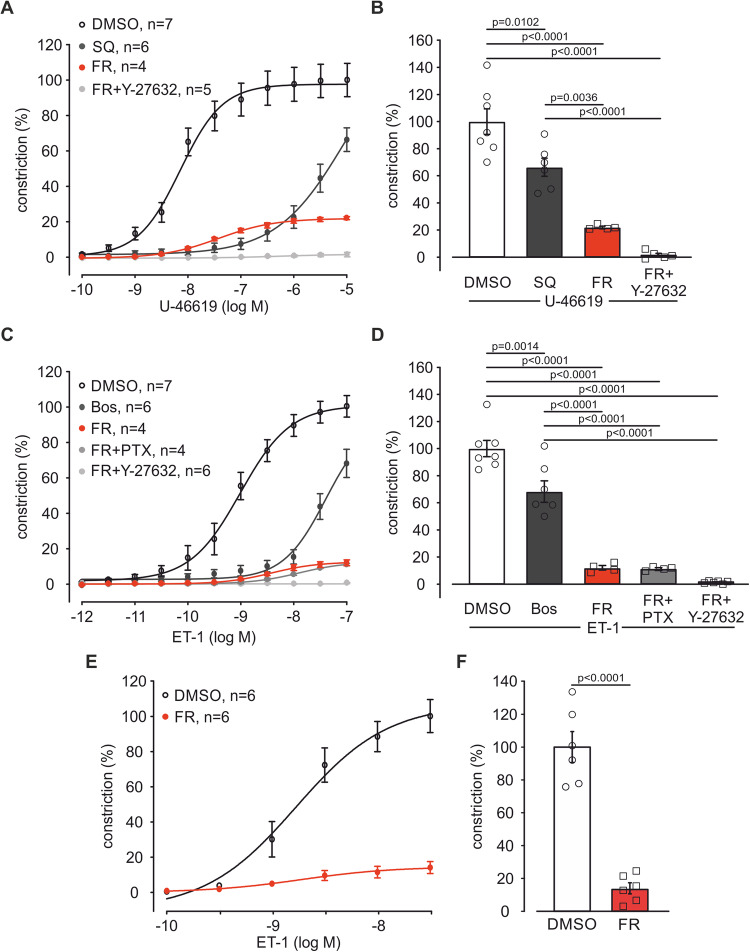
Figure 3. FR strongly diminishes U-46619- or ET-1-evoked vasoconstriction in PAs of mouse and pig.
(A) Dose–response curve of U-46619 (10−10 M–10−5 M) after pre-incubation with the solvent DMSO (n = 7), SQ (10−6 M, n = 6), FR (10−6 M, n = 4) or FR + Y-27632 (10−5 M, n = 5) in isometric force measurements of mouse PAs. (B) Statistical analysis of vasoconstriction at the highest U-46619 concentration applied (10−5 M) in the dose–response curve in (A). (C) Dose–response curve of ET-1 (10−12 M–10−7 M) after pre-incubation with the solvent DMSO (n = 7), Bos (10−6 M, n = 6), FR (10−6 M, n = 4), FR + PTX (1 µg/ml, n = 4) or FR + Y-27632 (10−5 M, n = 6) in isometric force measurements of mouse PAs. (D) Statistical analysis of vasoconstriction at the highest ET-1 concentration applied (10−7 M) in the dose–response curve in (C). (E) Dose–response curve of ET-1 (10−10 M–5 × 10⁻⁷ M) after pre-incubation with the solvent DMSO (n = 6) or FR (10−7 M, n = 6) in porcine PAs. (F) Statistical analysis of vasoconstriction at the highest ET-1 concentration applied (5 × 10⁻⁷ M) in the dose–response curve in (E). Data information: Values are expressed as mean ± SEM. (B, D) One-way ANOVA, Tukey’s post hoc test, (F) Unpaired student’s t-test. Source data are available online for this figure.

