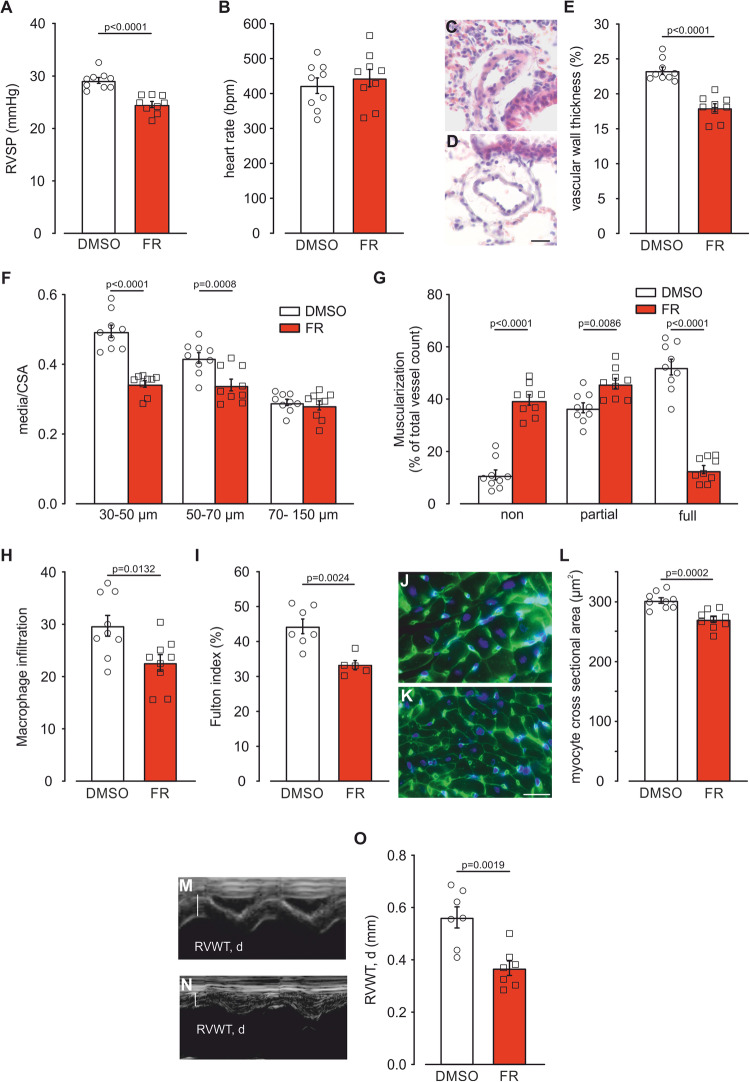
Figure 8. FR reverses SuHx-induced PH in mouse.
(A, B) Statistical analysis of RVSP (A) and heart rate (B) in mice treated with the solvent DMSO (n = 9) or FR (10 µg/mouse i.p., Monday to Friday, n = 9) in the last 2 weeks of 5 weeks SuHx (10% O2) exposure. (C, D) H&E-staining of lung sections from SuHx-DMSO (C) and SuHx-FR-treated mice (D), scale bar: 20 µm. (E–G) Statistical analysis of vascular wall thickness in mice treated with the solvent DMSO or FR during exposure SuHx (DMSO: n = 9, FR: n = 9) (E), ratio of media/CSA of small (30–50 µm), medium-sized (50–70 µm) and large (70–150 µm) PAs of mice exposed to SuHx (DMSO: n = 9, FR: n = 9) and muscularization of PAs (30–70 µm) of mice exposed to SuHx (DMSO: n = 9, FR: n = 9) (G). (H) Statistical analysis of macrophage infiltration in mice treated with the solvent DMSO or FR during SuHx exposure (DMSO: n = 9, FR: n = 9). (I) Statistical analysis of Fulton index in mice treated with the solvent DMSO or FR during SuHx exposure (DMSO: n = 7, FR: n = 5). (J, K) WGA staining of transversal heart sections from right ventricles of SuHx-DMSO (J) and SuHx-FR-treated mice (K), scale bar: 20 µm. (L) Statistical analysis of right ventricular cardiomyocyte cross sectional area in mice treated with DMSO (n = 9) or FR (n = 9) during exposure to SuHx. (M, N) Representative M-mode pictures of SuHx-DMSO (M) and SuHx-FR-treated mice (N) displaying diastolic right ventricular wall thickness (RVWT, d) during echocardiography. (O) Statistical analysis of RVWT, d in mice treated with DMSO (n = 7) or FR (n = 7) during exposure to SuHx. Data information: Values are expressed as mean ± SEM. (A, B, E, H, I, L, O) Unpaired student’s t-test, (F, G) Two-way ANOVA, Bonferroni post hoc test. Source data are available online for this figure.

