
Figure 3.
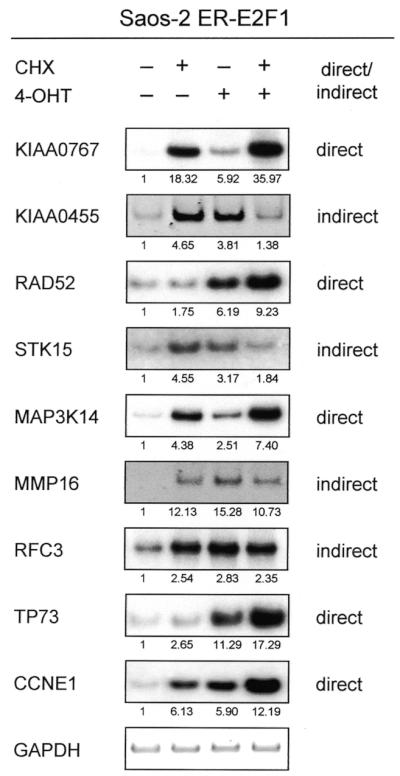
Classification of E2F1 targets as direct and indirect. Semi-quantitative RT–PCR analysis of different E2F1 regulated genes in serum-starved Saos-2 cells expressing ER–E2F1 grown in the presence of 4-OHT and/or CHX as indicated. All targets are shown 4 h after induction. KIAA0455, STK15, MMP16 and RFC3 are indirect targets, whereas KIAA0767, RAD52 and MAP3K14, as well as the controls TP73 and CCNE1 are direct targets. PCR products were quantified in relative software units by the Bio-Imaging-Analyzer (Fuji) using the TINA program version 2.09 (shown as fold induction). The data were normalized to GAPDH values and the untreated control was set as 1.