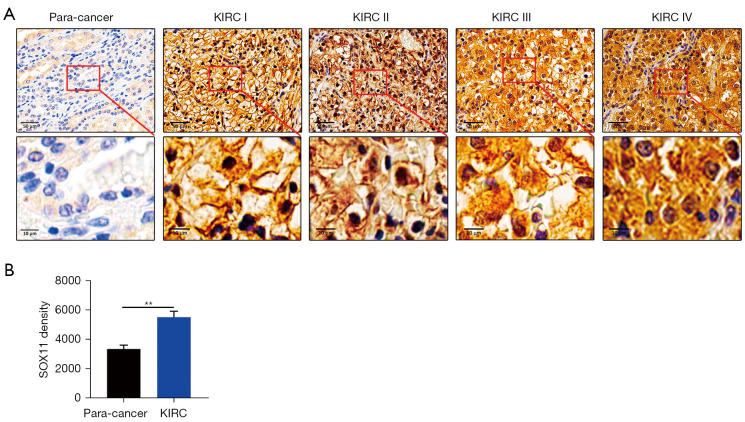
Figure 2.
The expression of SOX11 in KIRC tissues. (A) Representative images showing IHC staining results of SOX11 in KIRC tissues (KIRC I: pathologic stage I; KIRC II: pathologic stage II; KIRC III: pathologic stage III; KIRC IV: pathologic stage IV) and ANTs (scale bar, 50 µm). (B) Semiquantitative analysis of IHC staining (n=6). The difference between groups was evaluated by one-way ANOVA followed by the LSD post-hoc multiple comparisons test (n≥3). Data are presented as the mean ± SEM. **, P<0.01. KIRC, kidney renal clear cell carcinoma; SOX11, SRY-box transcription factor 11; ANT, adjacent normal tissue; IHC, immunohistochemical; ANOVA, analysis of variance; LSD, least significant difference; SEM, standard error of the mean.

