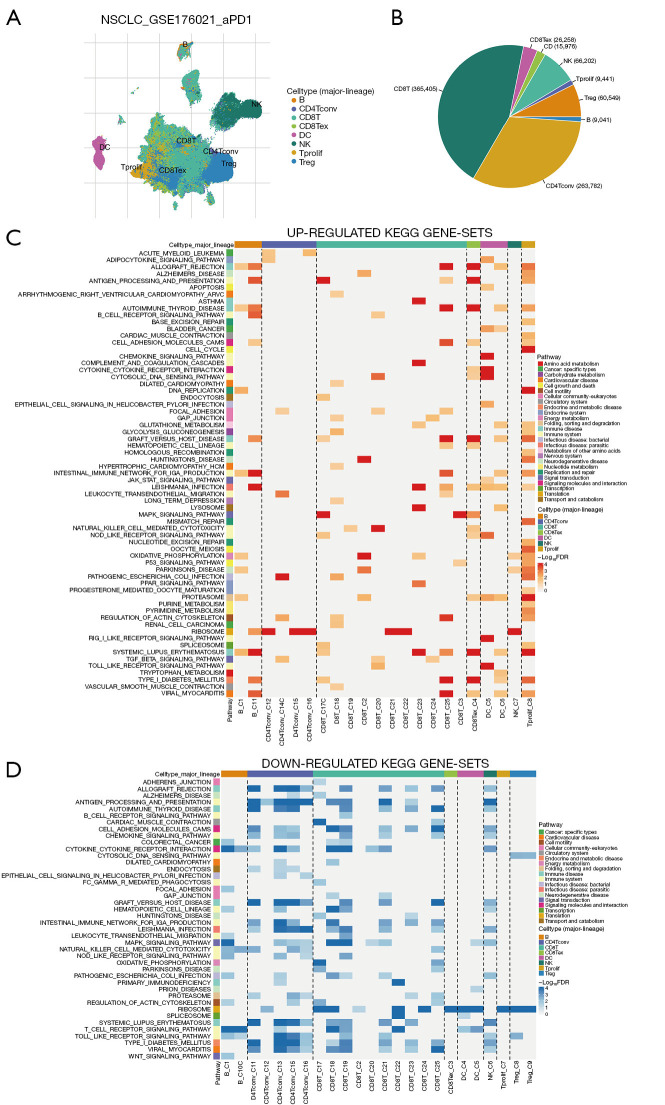
Figure 2.
Analysis of single-cell LUAD data utilizing the GSE176021 dataset. (A) UMAP plots displaying cells colored according to cell type were presented. (B) The pie plot illustrated the distribution of cell numbers across each cell type. (C) The heatmap depicted functionally enriched, up-regulated KEGG pathways, identified through differential genes in each cell type within the GSE176021 dataset. (D) The heatmap depicted functionally enriched, down-regulated KEGG pathways, identified through differential genes in each cell type within the GSE176021 dataset. NSCLC, non-small cell lung cancer; CD4Tconv, conventional CD4+ T cells; CD8T, CD8+ T cell; CD8Tex, exhausted CD8+ T cell; DC, dendritic cell; NK, natural killer; Tprolif, proliferating T cell; Treg, regulatory T cell; KEGG, Kyoto Encyclopedia of Genes and Genomes; FDR, false discovery rate; LUAD, lung adenocarcinoma; UMAP, Uniform Manifold Approximation and Projection.

