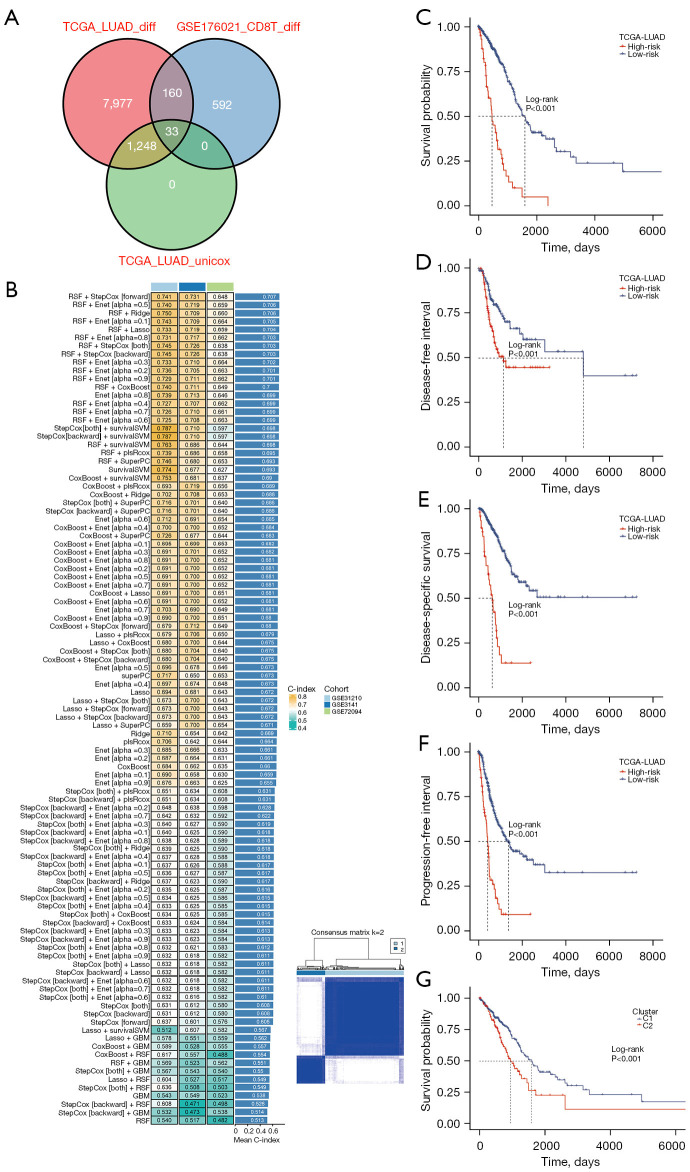
Figure 3.
A consensus riskScore was developed and validated via the machine learning-based integrative procedure. (A) Venn plot showed the intersection of genes from differential and prognosis analysis. (B) A total of 101 predictive models were developed using the LOOCV framework, with the C-index of each model calculated across all validation datasets. (C) Kaplan-Meier curves of OS according to the riskScore in TCGA-LUAD. (D) Kaplan-Meier curves of DFI according to the riskScore in TCGA-LUAD. (E) Kaplan-Meier curves of DSS according to the riskScore in TCGA-LUAD. (F) Kaplan-Meier curves of PFI according to the riskScore in TCGA-LUAD. (G) Patients are divided into two clusters by ConsensusClusterPlus and Kaplan-Meier survival curves of OS in two clusters. TCGA, The Cancer Genome Atlas; LUAD, lung adenocarcinoma; RSF, random survival forest; StepCox, stepwise Cox; Enet, elastic network; Ridge, ridge regression; Lasso, least absolute shrinkage and selection operator; survivalSVM, survival support vector machine; plsRcox, partial least squares regression for Cox; SuperPC, supervised principal components; GBM, generalized boosted regression modeling; C-index, concordance index; LOOCV, leave-one-out cross-validation; OS, overall survival; DFI, disease-free interval; DSS, disease-specific survival; PFI, progression-free interval.

