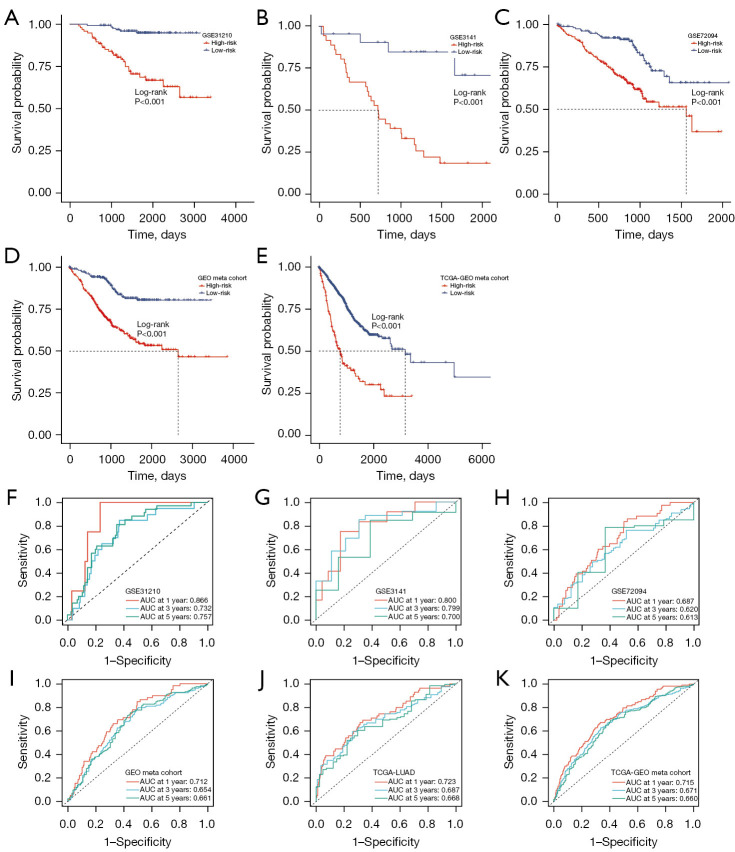
Figure 4.
Validation and evaluation of the riskScore model. (A) Kaplan-Meier curves of OS according to the riskScore in GSE31210. (B) Kaplan-Meier curves of OS according to the riskScore in GSE3141. (C) Kaplan-Meier curves of OS according to the riskScore in GSE72094. (D) Kaplan-Meier curves of OS according to the riskScore in GEO meta cohort. (E) Kaplan-Meier curves of OS according to the riskScore in TCGA-GEO meta cohort. (F) Time-dependent ROC analysis for predicting OS at 1, 3, and 5 years in GSE31210. (G) Time-dependent ROC analysis for predicting OS at 1, 3, and 5 years in GSE3141. (H) Time-dependent ROC analysis for predicting OS at 1, 3, and 5 years in GSE72094. (I) Time-dependent ROC analysis for predicting OS at 1, 3, and 5 years in GEO meta cohort. (J) Time-dependent ROC analysis for predicting OS at 1, 3, and 5 years in TCGA-LUAD. (K) Time-dependent ROC analysis for predicting OS at 1, 3, and 5 years in TCGA-GEO meta cohort. GEO, Gene Expression Omnibus; TCGA, The Cancer Genome Atlas; AUC, area under the ROC curve; ROC, receiver operating characteristic; LUAD, lung adenocarcinoma; OS, overall survival.

