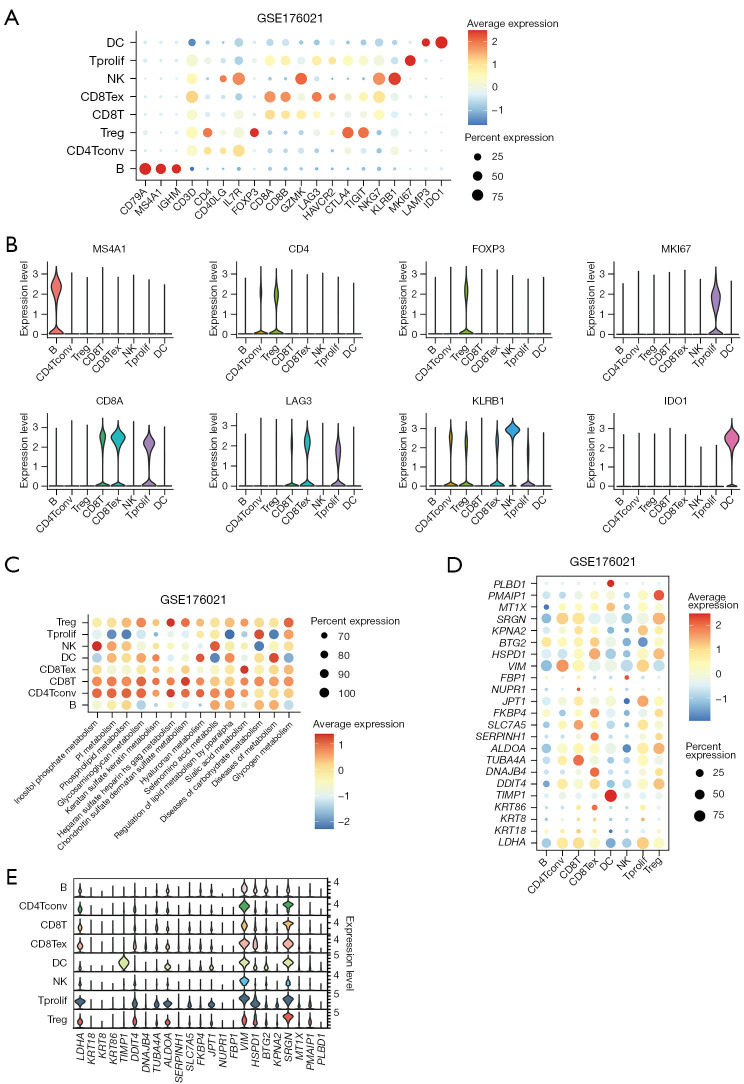
Figure 6.
The expression of classical markers and risk model genes across different subsets in scRNA-seq GSE176021 dataset. (A) The expression of some classical markers on dotplot across different cell subsets. (B) The expression of some classical markers on violin plots across different cell subsets. (C) The metabolic status of different clusters of cell types. (D) The expression levels of the genes selected for risk model on dotplot. (E) The expression levels of the genes selected for risk model on violin plot. DC, dendritic cell; Tprolif, proliferating T cell; NK, natural killer; CD8Tex, exhausted CD8+ T cell; CD8T, CD8+ T cell; Treg, regulatory T cell; CD4Tconv, conventional CD4+ T cells; scRNA-seq, single-cell RNA-sequencing.

