Figure 4.
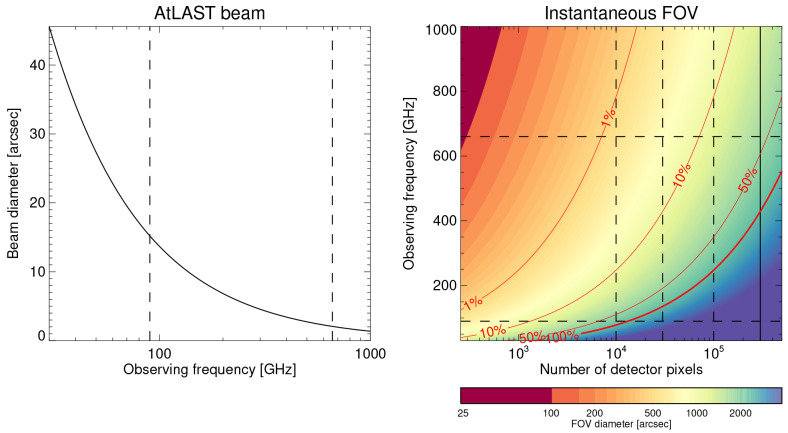
Left: AtLAST beam diameter as a function of observing frequency. The vertical dashed lines mark frequencies of 90 GHz and 660 GHz. Right: The resulting diameter of the instantaneous FOV as a function of number of detector pixels and observing frequency (see color legend). The resulting ratio of the FOV area and the whole disk of the Sun is overlaid as red contours. The dashed lines mark selected frequencies and detector numbers for reference. The pixels are assumed to have the size of the corresponding beam and are packed into a circle with no overlap. See Section 3.3 for details.

