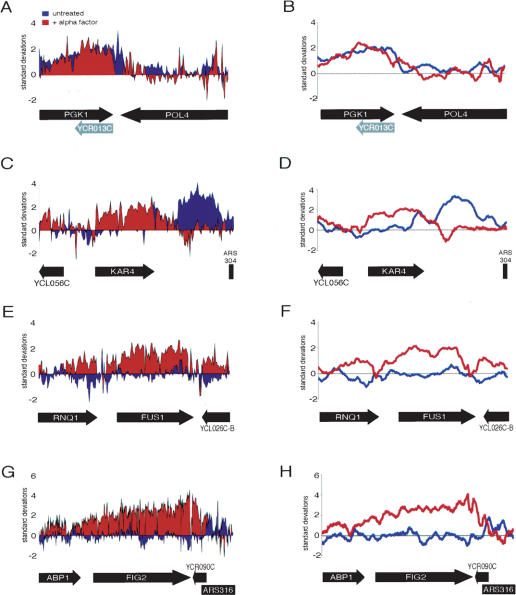
Figure 4.
Local changes in Mlp1 occupancy upon α-factor stimulation of transcription. Mlp1 binding to transcriptionally active regions are shown. Standard deviations for individual probes (A,C,E,G) as well as a moving average of binding for nine adjacent probes (B,D,F,H) are shown. ORFs are displayed as in Figure 2.

