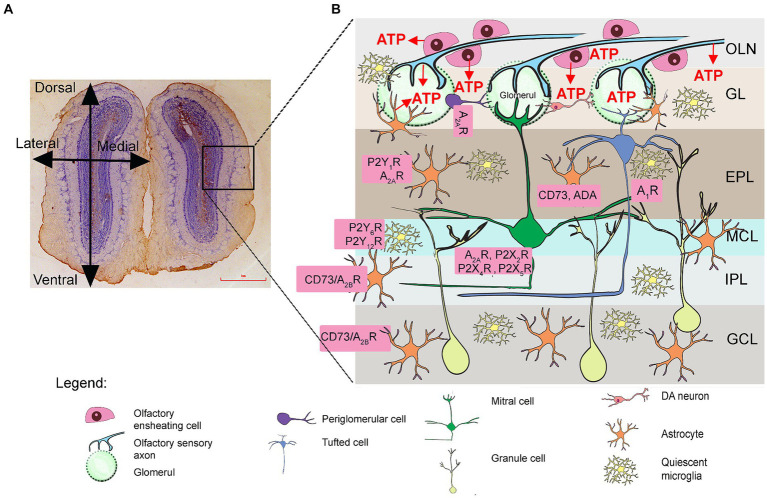
Figure 1.
Purinergic signaling in the olfactory bulb (OB). (A) Schematic representation of the OB tissue section (left) and schematic representation of the OB (right). The frame shows the part enlarged in the drawing in (B), showing the distribution of puronoreceptors and ectonucleotidases in the OB cellular network, based on physiological, immunological, and histochemical data (see Rotermund et al., 2019). ATP is released from sensory axon terminals and periglomerular astrocytes in the ONL and GL. Adenosine A1R and A2AR as well as P2X2R/P2X4R/P2X5R were identified in the mitral cells and tufted cells. The expression of P2Y1R and A2AR was detected in astrocytes in the GL, EPL, and MCL. Unusually high activity and expression of eN/CD73 and adenosine deaminase (ADA) were detected in the EPL, IPL, and GCL. GCL, granule cell layer; GL, glomerular layer; EPL, external plexiform layer; IPL, internal plexiform layer; MCL, mitral cell layer; ONL, olfactory nerve layer.

