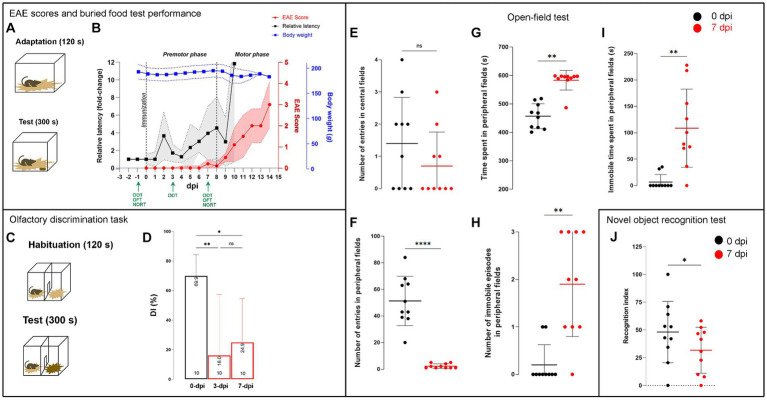
Figure 2.
Neurological data and behavioral testing in EAE. (A) Schematic representation of the buried food test protocol, consisting of a 120-s adaptation and a 300-s test series. (B) The timeline shows the changes in neurological scores (red circles), average body mass (blue squares), and relative latency (black squares) over the course of the EAE (dpi). Data are presented as mean ± SD (colored area). The dashed lines represent the day of immunization (0 dpi) and the day of onset of motor symptoms (8 dpi), which determine the duration of the premotor phase of EAE. Green arrows indicate the days on which the behavioral tests were performed. (C) Schematic representation of the olfactory discrimination test protocol and (D) variations in the discrimination index (DI), which represents the difference between the time spent in the unfamiliar and familiar compartments divided by the total time spent in both compartments × 100 (%). The olatfactory discrimination test was performed at −1, 3, and 7 dpi with three experimental units, and the data are expressed as mean DI (±SD). (E–I) Parameters from the open field test performed at −1 and 7 dpi with 3 experimental units, and data are expressed as mean ± SD. (J) Recognition index (RI), calculated in novel object recognition test, as the time spent with a new object relative to the total time spent exploring both objects × 100 (%). The test was performed at −1 dpi and 7 dpi with three experimental units, and the data are presented as mean (±SD). Significance within the graphs: *p < 0.05; **p < 0.01; ***p < 0.001.

