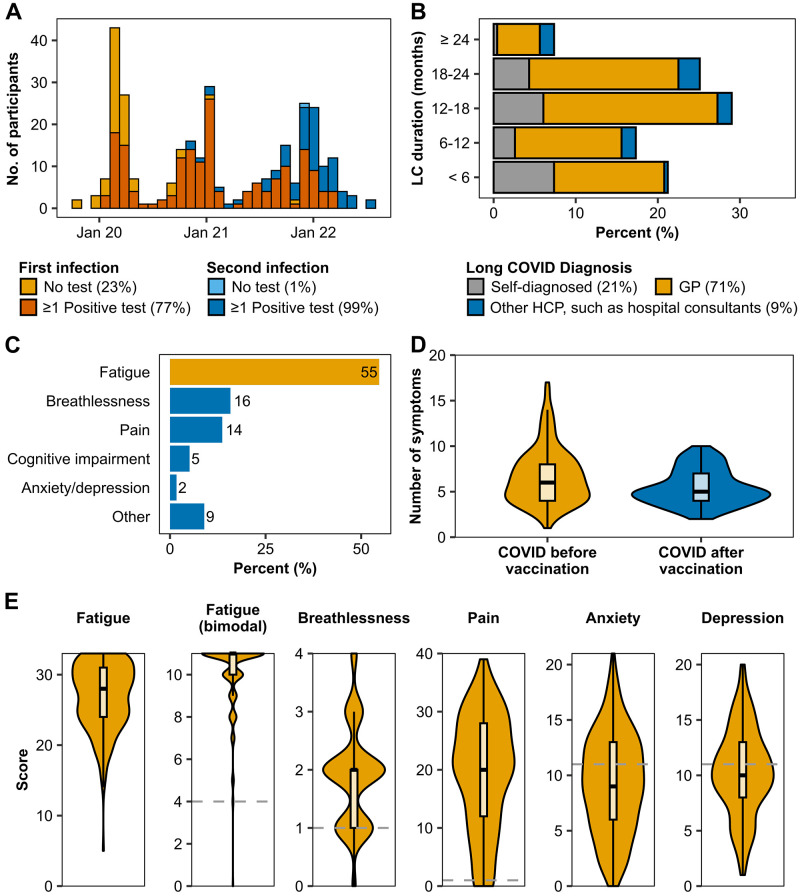
Figure 2. Covid-19 infection and Long COVID symptoms.
( A) COVID-19 infection dates: First COVID infection dates ranged from October 2019 to March 2022, and second infection dates ranged from November 2020 to July 2022. Most infections were confirmed by at least one positive COVID test (PCR, rapid antigen lateral flow test, or antibody test), shown in orange and dark blue. Yellow and light blue bars show the number of infections which were not confirmed by a COVID test. ( B) Long COVID duration: Figure shows the length of time in months participants were living with Long COVID at the start of the study. Long COVID was diagnosed either by a GP (yellow), a different healthcare professional (blue), or self-diagnosed (grey). GP: general practitioner, HCP: healthcare professional, LC: Long COVID. ( C) Percentage of the Long COVID symptom each participant selected as the one they would most like to see improve. The most selected symptom (fatigue) is highlighted in yellow. ( D) Number of Long COVID symptoms (core symptoms and symptom groups) in people who had COVID before (yellow) and after (blue) vaccination. Difference between the groups was significant (p=0.003). ( E) Core Long COVID symptoms: Fatigue, breathlessness, pain, anxiety, and depression were assessed using validated questionnaires (Chalder Fatigue Scale, modified MRC Dyspnoea Scale, P4 pain scale, Hospital Anxiety and Depression Scale). Fatigue is represented as total fatigue score and bimodal scoring. The y-axes show complete range of possible scores for each scale (0 to 33, 11, 4, 40, 21, 21 for fatigue total, fatigue bimodal, breathlessness, pain, anxiety, and depression, respectively), with higher scores indicating greater severity. The grey dashed line shows the cutoffs used for caseness of the symptoms. No cutoff for total fatigue score was used to determine caseness.

