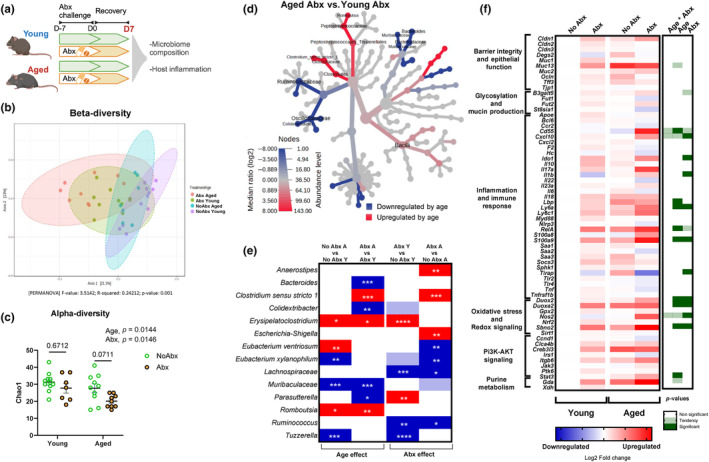
FIGURE 4.

Age impacts gut microbiome and intestinal inflammation during recovery from treatment with antibiotics. (a) A schematic representation of antibiotic experiment. Mice were exposed to broad‐spectrum antibiotics (Abx) in drinking water for 7 days and then were switched to regular drinking water for an additional 7 days. Microbiome and gene expression analyses were carried out in proximal colon contents and tissue, respectively. All panels convey data from D7 (7 days after cessation of Abx treatment). (b) Microbiome β‐diversity Bray–Curtis—principal coordinate analysis (PcoA); dotted line ellipses corresponding to clusters in each group. (c) Microbiome α‐diversity—Chao‐1 represents community richness in aged versus young mice exposed to antibiotics. (d) Heat tree representing taxa changes in aged versus young mice, both treated with antibiotics. (e) Bacterial genera significantly altered by age and/or antibiotics—significant changes assessed by Kruskal–Wallis nonparametric test in taxa abundance. Dark red significant increase, dark blue‐significance decrease *p < 0.05; **p < 0.01; ***p < 0.001; ****p < 0.0001. Light colors (blue or red) represent tendency (0.05 < p ≤ 0.1) and white indicates nonsignificant (p > 0.1) changes in taxa abundance. Y = young, A = aged. Microbiome data correspond to n = 3 cohorts with n = 7–11 per group. (f) Heat map of distal colon gene expression analyzed via Fluidigm. Blue indicates downregulation and red indicates upregulation compared to young mice. Each square represents the mean gene expression per group (n = 8–12). The right panel visually conveys statistical significance: white implies no effect (p > 0.10), light green represents a trend (0.05 < p ≤ 0.10), and dark green indicates a significant change (p ≤ 0.05). Gene expression data correspond to n = 3 cohorts with n = 12–15 per group.
