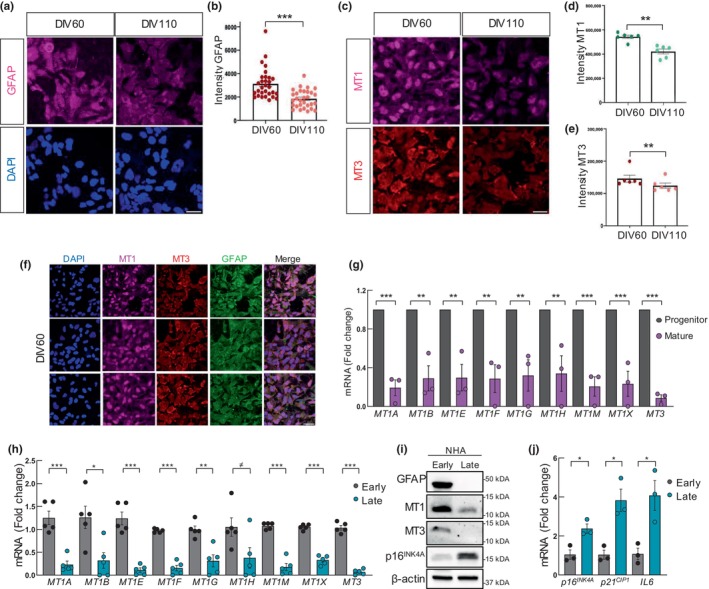
FIGURE 4.

MTs expression decreases in cultured human astrocytes. (a, b) Representative immunofluorescence (IF) images and quantification of GFAP expression in hPSC‐derived astrocyte progenitors (day‐in vitro 60) and more mature astrocytes (day‐in vitro 110). Scale bar = 50 μm. (c) Representative IF images of MT1 and MT3 expression in astrocytes at DIV60 versus DIV110 (n = 3). Scale bar = 50 μm. (d, e) Quantification of the mean intensity of MT1 and MT3 in astrocytes at DIV60 and DIV110 (n = 3). (f) Representative images of GFAP, MT1, and MT3 in hPSC‐derived astrocytes at DIV60 (n = 3). Scale bar = 50 μm. (g) mRNA levels of MT isoforms in astrocytes at DIV53‐62 (progenitor) and DIV104‐110 (mature). (h) mRNA levels of MT isoforms in normal human astrocytes (NHA) cultured at early (1–3) and late (12–18) passages (n = 5). (i) Representative Western Blot of GFAP, MT1, MT3, and p16 INK4A in NHA at early and late passage (n = 3). (j) Expression of p16 INK4A , p21 CIP1 , IL6 in NHA cultured at early (2, 3) and late (15–17) passages (n = 3). The statistical significance was assessed with the Student's t‐test (≠ p < 0.1, *p < 0.05, **p < 0.01, ***p < 0.001).
