
FIGURE 1.
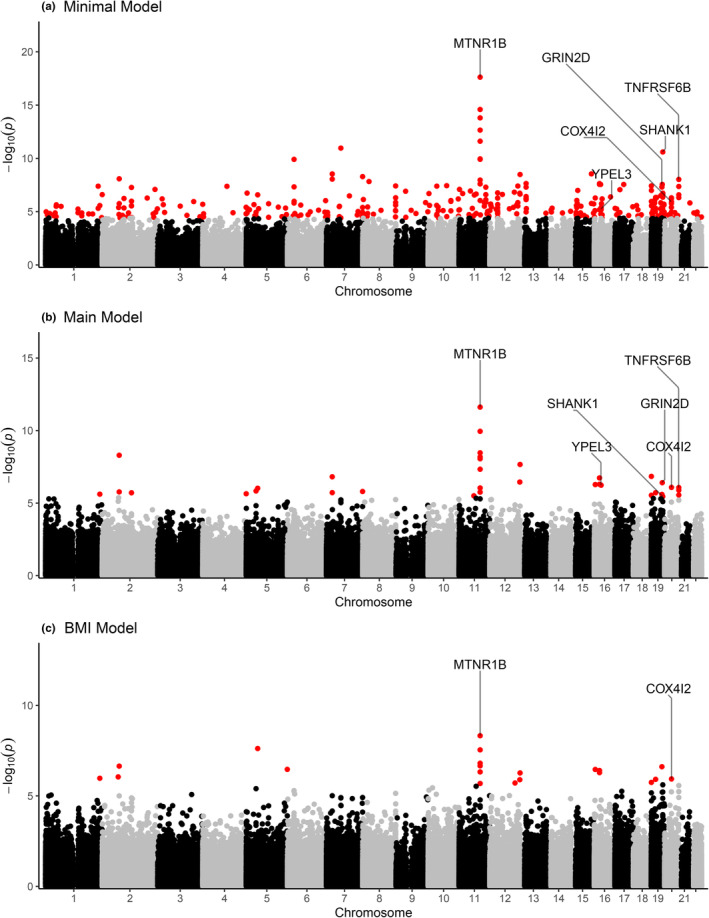
Manhattan plots for maternal age newborn blood EWAS. The Manhattan plots correspond to covariate adjustments for (a) cell type and batch, (b) additionally for maternal smoking, maternal education, maternal race/ethnicity/ancestry, parity, and selection (as applicable), and (c) additionally for BMI. Color indicates PFDR < 0.05.