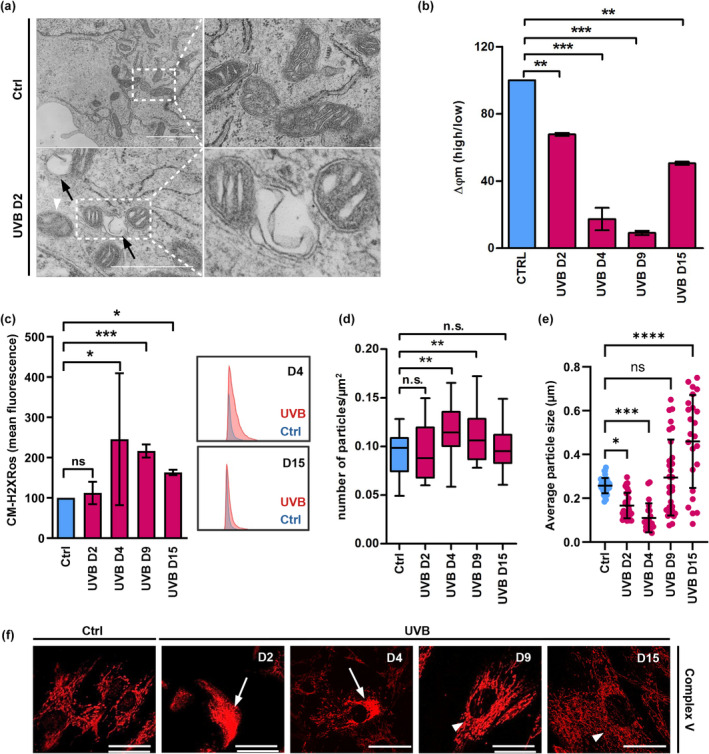
FIGURE 1.

UVB irradiation impairs mitochondrial morphology and physiology. (a) Human dermal fibroblasts submitted to 2 days of UVB irradiation, and the corresponding controls were processed and analyzed by TEM. Details show healthy mitochondria in control non‐irradiated cells and blebbing damaged mitochondria after 2 days of UVB irradiation. Black arrows: blebbing of mitochondrial membrane, white arrowheads: mitochondria with disorganized cristae. (b, c) UVB‐irradiated and control HDF were labeled with the fluorescent probes JC‐1 (b) and CM‐H2XRos (c) and analyzed by FACS for the evaluation of the effects of UVB on mitochondrial membrane potential and mitochondrial ROS levels, respectively (b) Mitochondrial membrane potential of Ctrl and UVB‐irradiated cells. Bars represent the ratio obtained by dividing the percentage of mitochondria with high membrane potential by the percentage of mitochondria with low membrane potential of a given population. Results are displayed as mean values of three independent biological samples ± SD. Controls were normalized to 100% for better interpretation of the results. (c) Mitochondrial ROS in Ctrl and UVB‐irradiated HDF. Results are displayed as mean values ± SD of three independent experiments. Histograms are representative of control (blue) and irradiated (red) cells measured on days 4 and 15 of the experiment. (d–f) Human dermal fibroblasts were irradiated, labeled by indirect immunofluorescence with antibody to detect the mitochondrial Complex V subunit ATP Synthase beta and observed in confocal microscopy to evaluate mitochondrial network morphology. (d, e) Analysis of mitochondrial network fragmentation (d) and mitochondrial particle size (e) was performed in ImageJ software using the images obtained from 90 cells randomly chosen from three independent experiments. (f) Representative images of mitochondria in control and UVB‐irradiated HDF. White arrows: impaired mitochondrial network. White arrowheads: recovered mitochondrial network. Scale bar: 10 μm. For all experiments: *p ≤ 0.05; **p ≤ 0.01; ***p ≤ 0.001; n.s., non‐significant.
