FIGURE 2.

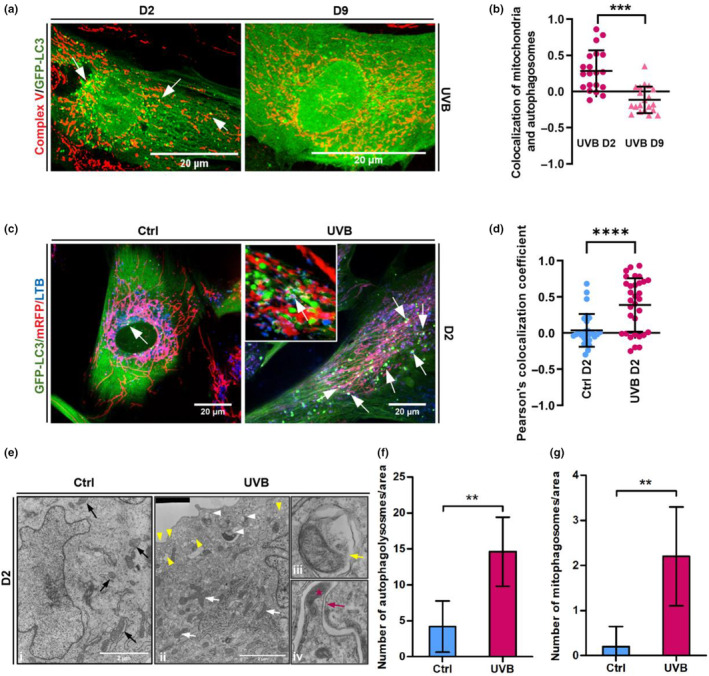
Mitochondria damaged by UVB are eliminated by mitophagy. (a) HDF expressing GFP‐LC3 were grown on coverslips and UVB‐irradiated. Immediately after the second day of irradiation (D2) or after 4 days of irradiation followed by 5 days of recovery (D9), cells were fixed and stained by indirect immunofluorescence with anti‐complex V (red) antibody and observed by confocal microscope. Single channels for each figure are displayed in Figure S1A. Colocalization of mitochondria and autophagosomes (white arrows) was quantified in ImageJ software and coefficient of colocalization of at least 30 cells of three independent experiments is represented in (b). Values above 0 represent positive colocalization and values under 0 represent negative colocalization. (c) GFP‐LC3/mRFP‐expressing fibroblasts exposed to 2 days of irradiation and the corresponding controls were stained with Lysotracker® Blue and observed by live cell confocal microscopy to investigate the elimination of mitophagosomes by mitophagy. White arrows point the co‐localization of autophagosomes (green), mitochondria (red) and lysosomes (blue). Images are representative of three independent experiments. Inset shows 3D detailed colocalization of mitochondria, autophagosomes and lysosomes in a UVB‐irradiated cells. Scale bars: 20 μm. Single channels for each picture are displayed in Figure S1F. (d) Coefficient of colocalization of mitochondria and lysosomes of control and UVB‐irradiated cells obtained by ImageJ software. Results are represented as mean value ± SD of three independent experiments. (e) Human dermal fibroblasts submitted to 2 days of UVB (ii‐iv) and the corresponding controls (i) were processed and analyzed by TEM to confirm the occurrence of mitophagy upon UVB irradiation. Black arrows (i): healthy mitochondria observed in control cells. White arrows (ii): mitochondria with damaged cristae in UVB‐irradiated cells. White arrowheads (ii): damaged mitochondria being engulfed by a forming autophagosome. Yellow arrowheads (ii): non‐mitophagic vesicles. iii: mitochondria contained inside mitophagosome (yellow arrow) in UVB‐treated HDFs. iv: mitochondria (red star) being engulfed by a forming autophagosome (red arrow). Scale bar: 2 μm. (f, g) Quantification of number of autophagy‐related organelles (f) and mitophagosomes (g) observed in electromicrographs from Control and UVB‐irradiated cells. Bar graphs represent the mean values ± SD of at least 10 cells. For all experiments: *p ≤ 0.05; **p ≤ 0.01; ***p ≤ 0.001; n.s., non‐significant.
