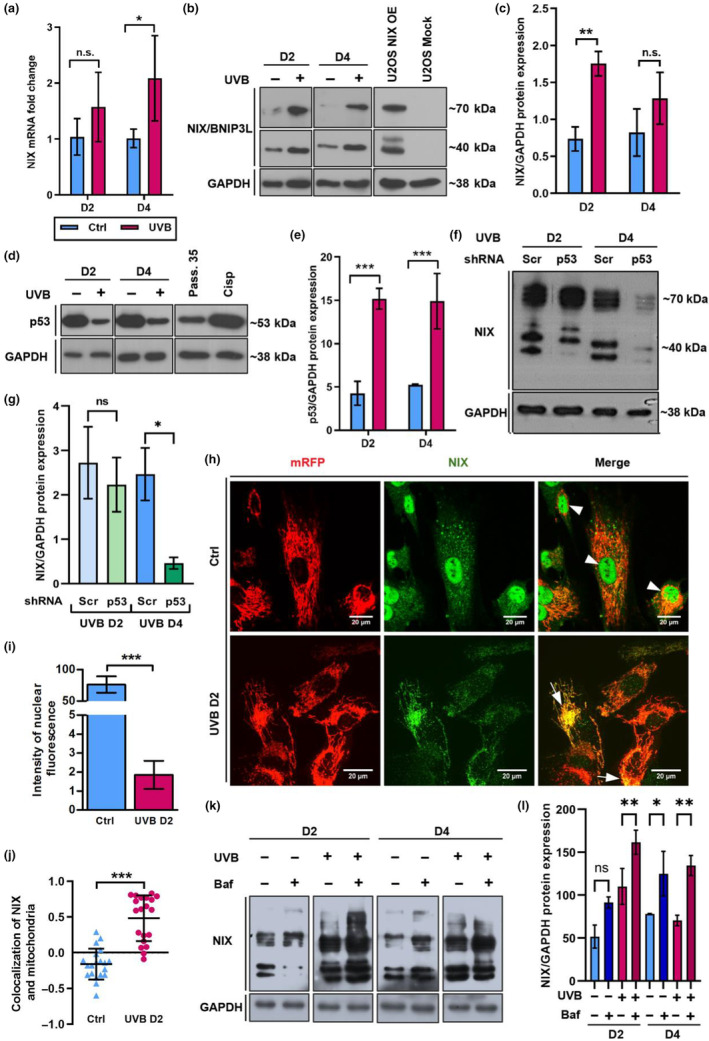
FIGURE 3.

Expression and subcellular localization of mitophagy receptor NIX are regulated during UVB‐induced senescence. (a, b) Wild type HDF were irradiated as described. mRNA samples and protein lysates were obtained and analyzed by q‐RT‐PCR (a) and WB (b) respectively, to verify regulation of the mitophagy receptor NIX upon UVB. (a) Bars represent mean values of three independent experiments ± SD. (b) NIX protein expression was analyzed by WB in UVB‐irradiated and control HDFs. Lysates of U2OS transfected with NIX overexpression and Mock (empty) plasmids were used as positive and negative controls for the antibody specificity, respectively. Images are representative of three independent biological replicates. (c) Bar graph represents mean values obtained by densitometry evaluation of NIX positive bands of three independent experiments ± SD. (d) WB to evaluate the expression of upstream NIX regulator p53 in control and UVB‐irradiated cells. HDF at passage 35 (Pass. 35) and HDF treated with cisplatin (33 μM) (Cisp) were used as positive controls for antibody specificity. (e) Bar graph represents mean values obtained by densitometry evaluation of p53 positive bands of three independent experiments ± SD. (f) WB to evaluate NIX expression in UVB‐irradiated Scr and p53 KD HDF. (g) Bar graph represents mean values obtained by densitometry evaluation of NIX positive bands of three independent experiments ± SD. (h) Fibroblasts expressing mRFP (red) irradiated for 2 days (UVB D2) and the corresponding control (Ctrl D2) were fixed and processed for indirect immunofluorescence. NIX was detected with appropriate antibodies and is shown in green. Overlaying of the two channels was obtained by the microscope software and co‐localization is characterized by yellow color (white arrows). Images are representative of three independent experiments. Scale bar: 20 μm. Intensity of NIX nuclear fluorescence (i) and colocalization of NIX (green) and mitochondria (red) (j) in at least 50 cells per group were evaluated by ImageJ software. Graphs represent mean values of three independent experiments ± SD. (k) WB to evaluate NIX expression in control and UVB‐irradiated HDF in the absence and presence of Bafilomycin A. (l) Bar graph represents mean values obtained by densitometry evaluation of NIX positive bands of three independent experiments ± SD. For all experiments *p ≤ 0.05; **p ≤ 0.01; ***p ≤ 0.001; n.s., non‐significant.
