FIGURE 4.

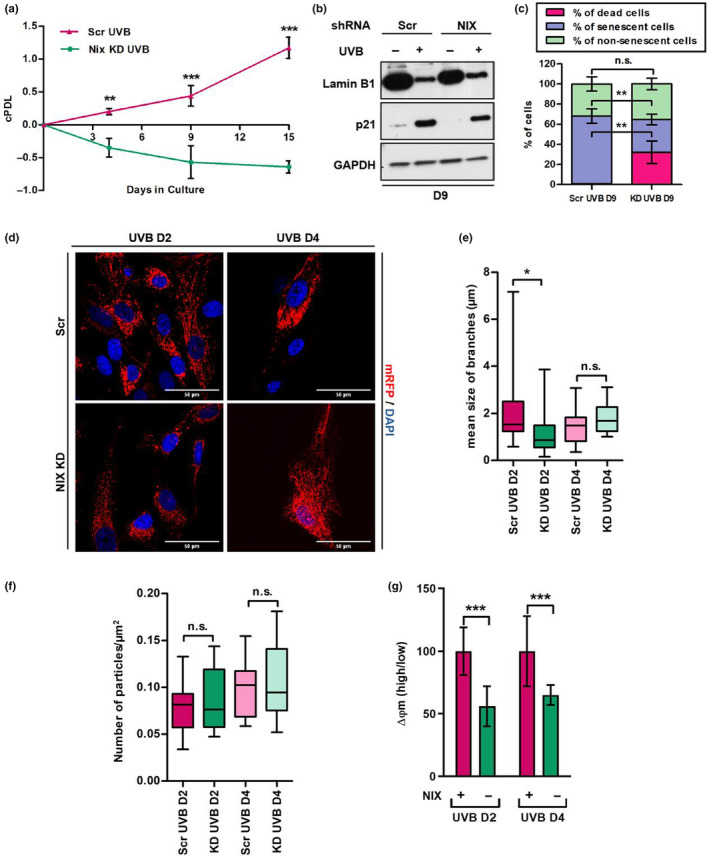
NIX KD leads to sustained mitochondrial damage and changes the fate of UVB‐irradiated fibroblasts from senescence to cell death. Fibroblasts were transduced with lentiviral vectors carrying NIX or scrambled shRNAs and grown under selection. Resulting NIX KD and Scr cells were irradiated twice a day for 4 days and monitored for cell growth (a) expression of senescence‐related proteins (b) and activity of SA‐β‐Gal (c). (a) Cumulative population doublings of the given populations represent mean values of three independent experiments ± SD. (b) WB to evaluate the expression of Lamin B1 and p21 in UVB‐irradiated Scr and NIX‐depleted HDF. GAPDH was used as loading control. Image is representative of three independent experiments. (c) SA‐β‐gal cytochemistry for detection of senescent cells. Blue positive cells were counted, and the percentage of positive cells was calculated dividing the number of positive cells by the total number of cells in a given sample. Number of dead cells was counted by Casy counter. Bars represent mean values of three independent experiments ± SD. For each group at least 400 cells were counted. (d) HDF expressing mRFP were transduced with lentiviral vectors carrying NIX or scrambled shRNAs and grown under selection. The resulting cells were submitted to UVB treatment as described and processed for confocal microscopy. Nuclei were stained with DAPI. Representative images of three independent experiments comparing Scr and NIX KD cells on D2 and D4 of the experiment are shown. (e, f) Analysis of size of mitochondrial branches (e) and number of particles (f) was performed in ImageJ software. Boxes represent minimum, maximum and median length ± SD of mitochondrial branches/particles observed after 2 or 4 days of irradiation. (g) Mitochondrial membrane potential of Scr and NIX KD HDF was accessed by FACS with the use of JC‐1 following 2 and 4 days of UVB. Bars represent the ratio obtained by dividing the percentage of mitochondria with high membrane potential by the percentage of mitochondria with low membrane potential of a given population. Graphic is displayed as mean values of three independent biological samples ± SD. Controls were normalized to 100% for better interpretation of the results. For all experiments *p ≤ 0.05; **p ≤ 0.01; ***p ≤ 0.001; n.s., non‐significant.
