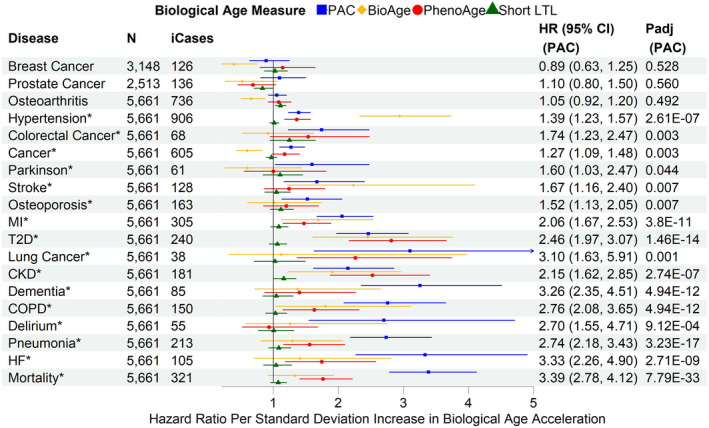
FIGURE 3.

Associations of biological age acceleration based on different biological age measures with all‐cause mortality and incident diseases using disease‐free participants in the combined training and test set, and fully adjusted models. SD: standard deviation of each measure after the inverse normal transformation in the combined training and test set to convert the original measurements to z‐scores (approximately 1 across measures). CKD, chronic kidney disease; COPD, chronic obstructive pulmonary disease; HF, heart failure; MI, myocardial infarction; T2D, type 2 diabetes; N: sample size with complete data for partially adjusted models of PAC, BioAge, PhenoAge, and short LTL, after excluding participants diagnosed with any of the diseases at or prior to baseline. ICases: number of incident cases of N samples. Cox regression model for all‐cause mortality and Fine‐Gray subdistribution hazard models to account for the effect of death on the risk for incident diseases. The partial covariate adjustment included chronological age, sex, ethnicity, education, Townsend deprivation index, smoking status, and body mass index. padj: p‐values adjusted for multiple testing per biological age measure (n = 19). Disease/all‐cause mortality highlighted with asterisk (*) if p adj<0.05.
