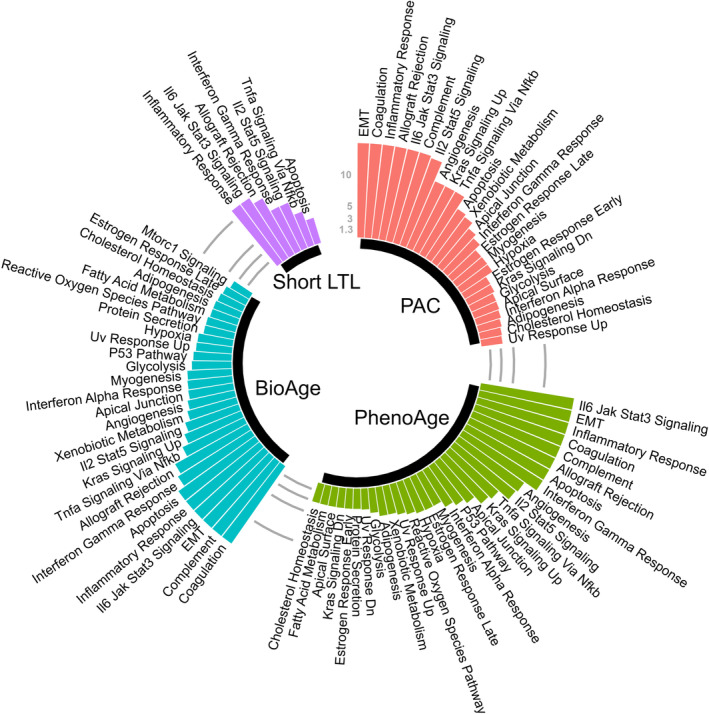
FIGURE 5.

Hallmark gene sets enriched with genes associated with BA deviation based on different BA measures. The colored bars represent −log10 (p) for different biological age measures after Bonferroni correction (n = 50) and those greater than 15 are truncated at 15. EMT: Epithelial Mesenchymal Transition.
