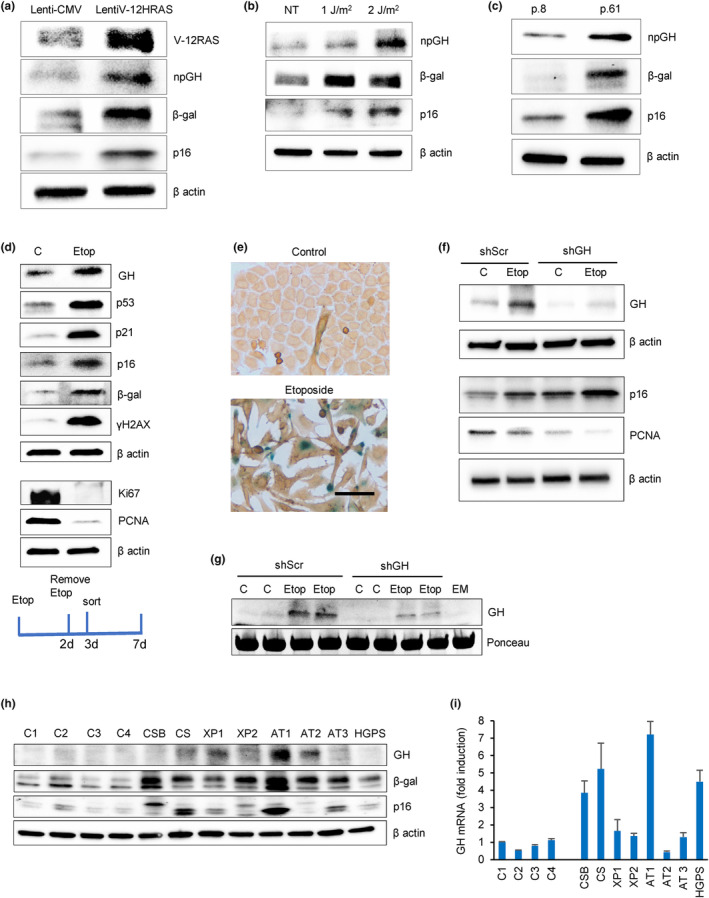
FIGURE 1.

GH is induced in different senescence models and is a SASP component. (a) Oncogene‐induced senescence. Western blot of hNCC infected with lentivirus‐expressing, constitutively activated mutant V‐12HRAS oncogene (lentiV‐12HRAS) or empty vector (lenti‐CMV) and analyzed 7 days later. (b) DNA damage‐induced senescence. Western blot of hNCC exposed to indicated doses of UVC light or left untreated (NT) and analyzed 6 days later. (c) Replicative senescence. Western blot of hNCC passaged until proliferation was significantly reduced. Cells from Passage 8 (p.8) and Passage 61 (p.61) were compared. (d) Western blot of senescence markers in hNCC treated with DMSO (control) or 50 μM etoposide for 48 h and analyzed 7 days after beginning treatment. (e) Representative images of hNCC treated with DMSO (Control) or with 50 μM etoposide for 48 h and stained for SA‐β‐gal (blue) and GH (brown) 6 days after beginning treatment. Note that only senescent cells express GH. Scale bar = 20 μm. (f, g) hNCC were infected with lentivirus expressing shScr as control or shGH, treated with 50 μM etoposide (Etop) or DMSO (C) for 48 h, and analyzed 6 days after beginning treatment. (f) Western blot of cell GH and senescent marker expression. (g) Western blot of secreted GH in culture medium (in duplicate). EM, empty medium. Medium concentration was equalized according to cell number in wells. Ponceau was used as a loading control. (h) Western blot of GH and senescence markers and (i) real‐time PCR of GH in human fibroblasts derived from indicated progeroid syndrome patients and healthy volunteers as controls (C). AT, ataxia telangiectasia; CS, Cockayne syndrome; CSB, Cockayne syndrome group B; HGPS, Hutchinson–Gilford progeroid syndrome; XP, xeroderma pigmentosa. ImageJ quantification of western blots is depicted in Figure S1A and S2A,B,D,E. In a–d, f, and g, representative blots from at least three independent experiments are shown.
