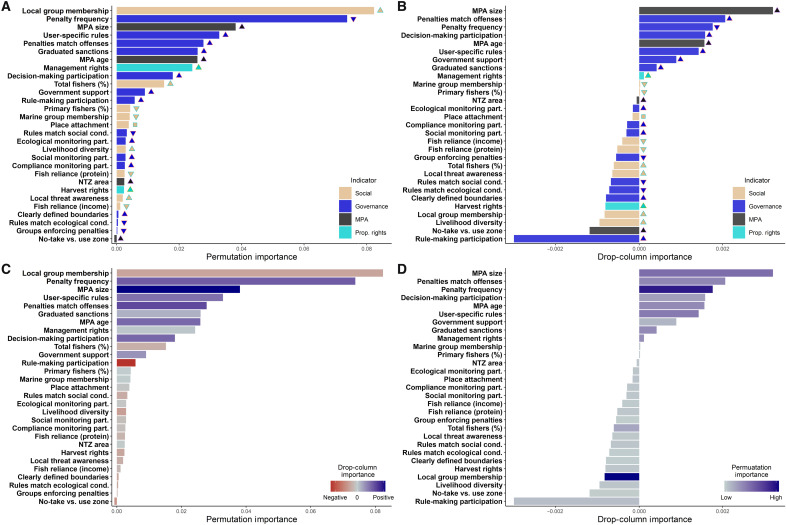
Fig. 2. Relative importance of social, governance, and MPA indicators.
Variable importance by permutation importance (A and C) and drop-column importance (B and D). The colors of bars in (A) and (B) represent the category of each indicator, while the directionality of impacts of indicators on MPAEffect is represented by shapes to the right of each bar (positive: upward triangle; negative: downward triangle; variable: square). Color ramps in (C) and (D) represent the relative importance of each metric by drop-column importance and permutation importance, respectively.

