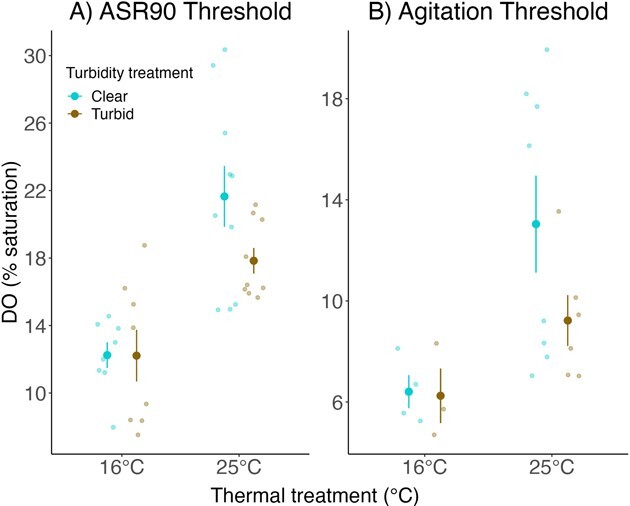
Figure 4.

ASR90 thresholds (A) and agitation thresholds (B) of Pugnose Shiner after a 12-week acclimation period. Water temperature during the acclimation period is indicated on the x-axis and turbidity is indicated by colour (blue for clear water (~ 0 NTU) and brown for turbid water (8.5 NTU)). Larger points on the graph represent mean ± SEM while smaller points represent the raw data. Error bars and means in the figure are calculated using the raw data and are not corrected for the variance due to the aquarium random effect.
