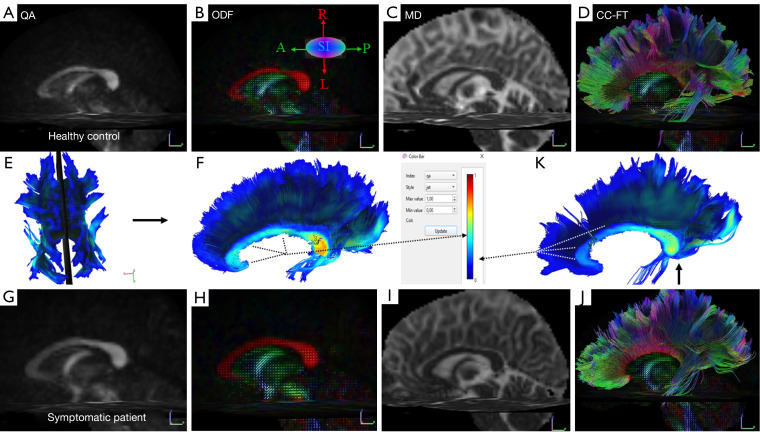
Figure 3.
Representative multiparametric diffusion maps in a 45-year-old healthy female control [(A-F) top row] and a 45-year-old symptomatic female patient [(G-K) bottom row]. The color bar (middle row) visually represents the local index of the QA values in the mid-sagittal slice (E) of the corpus callosum fibers, illustrating the differences between the aforementioned control subject (F) and the symptomatic post-COVID-19 patient (K). The directions of the ODF are pseudo-colored: red in the left-right direction (L-R), blue in the superior-inferior direction (S-I), and green in the anterior-posterior (A-P) direction. QA, quantitative anisotropy; ODF, orientation distribution function obtained from q-sampling imaging; MD, mean diffusivity; CC-FT; corpus callosum-fiber tracking; COVID-19, coronavirus disease 2019.

