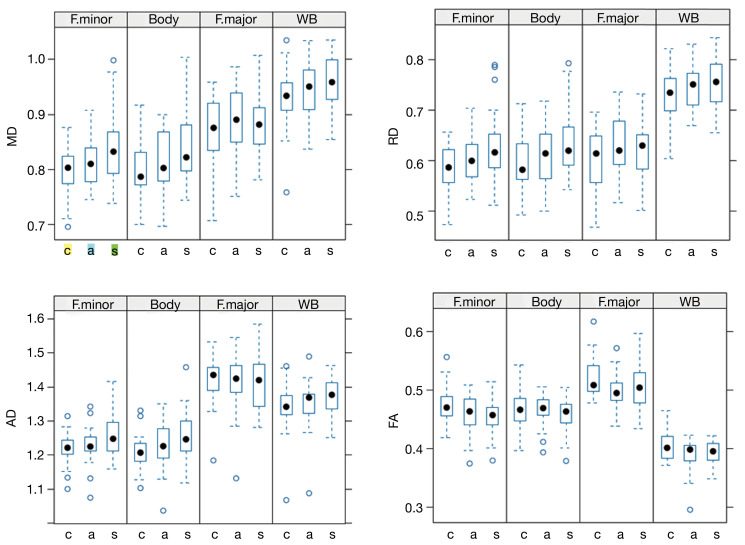
Figure 4.
The trend of increasing MD values when comparing controls, asymptomatic, and symptomatic patients. A post-hoc analysis showed significant differences between control and symptomatic patients in the forceps minor (P=0.001) and body of the CC (P=0.003), but not in the Forceps major (P=0.7) or WB (P=0.46). Similar trends were observed in other DTI-based metrics: RD and AD values increased, while FA values decreased, although these changes were not statistically significant. • full circles represent median values; while open circles ° denote outlier values. The MD, RD, and AD are expressed in units of mm2/s ×10−3. MD, mean diffusivity; F. minor, forceps minor; F. major, forceps major of the CC; WB, whole-brain; c, controls; a, asymptomatic patients; s, symptomatic patients; RD, radial diffusivity; AD, axial diffusivity; FA, fractional anisotropy; CC, corpus callosum; DTI, diffusion tensor imaging.

