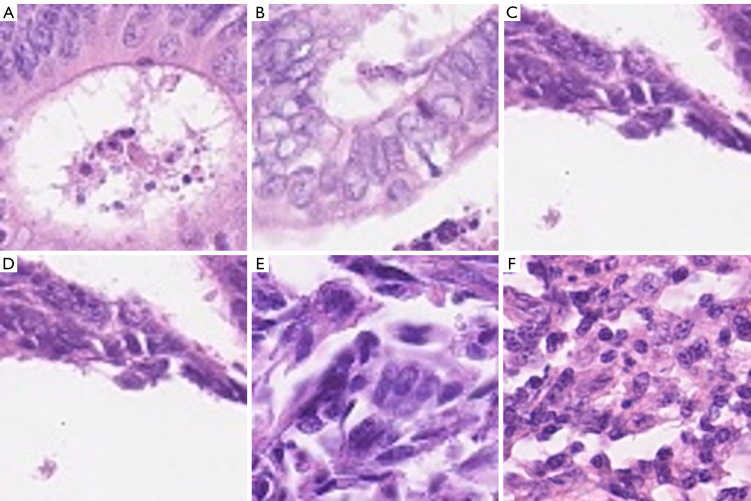
Figure 1.
Colorectal cancer histopathology images. (A-E) Tumor samples. (F) Inflammation. The images are from the CRC-TP database and have been reprinted with permission from Javed et al. (25). Samples were stained with hematoxylin and eosin and images obtained at 20× magnification. CRC-TP, Colorectal Cancer Tissue Phenotyping.

