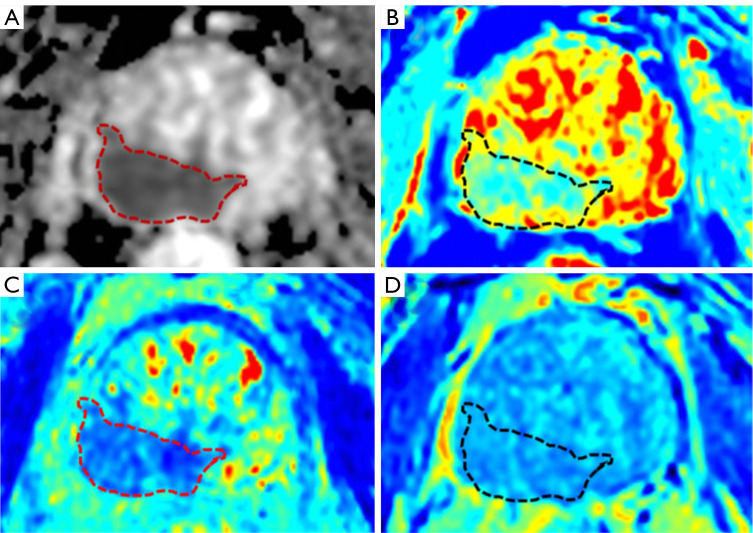
Figure 2.
Representative images from an 82-year-old patient with PCA and a serum PSA level of 60.21 ng/mL, with biopsy GS =4+4. The PCA lesion is primarily located in the right peripheral zone, as indicated by the dotted lines. (A-D) The ADC, T1, T2, and PD maps, respectively. The SyMRI parameter maps clearly demonstrate the tumor’s margins and suspicious signal regions, with all parameter values of the PCA lesion being lower than those of the surrounding normal prostate tissue. PCA, prostate cancer; PSA, prostate-specific antigen; GS, Gleason Score; ADC, apparent diffusion coefficient; PD, proton density; SyMRI, synthetic magnetic resonance imaging.

