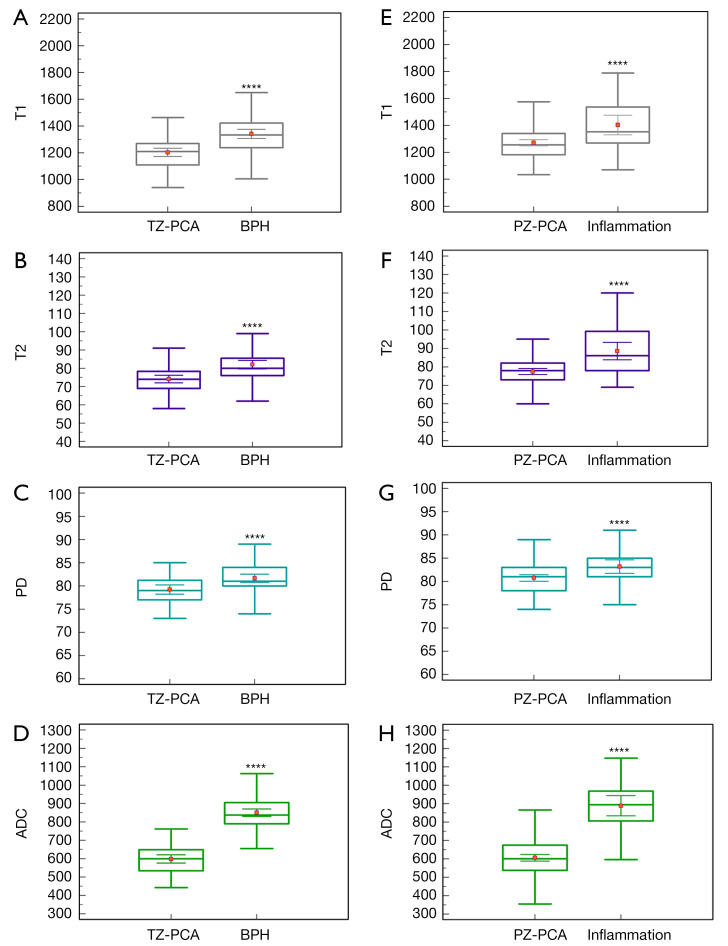
Figure 3.
Boxplots of comparisons for the T1 (A,E), T2 (B,F), PD (C,G), and ADC (D,H) values between PCA and BPH in the TZ and between PCA and inflammation in the PZ. ****, P<0.001. TZ, transformation zone; PCA, prostate cancer; BPH, benign prostatic hyperplasia; PZ, peripheral zone; PD, proton density; ADC, apparent diffusion coefficient.

