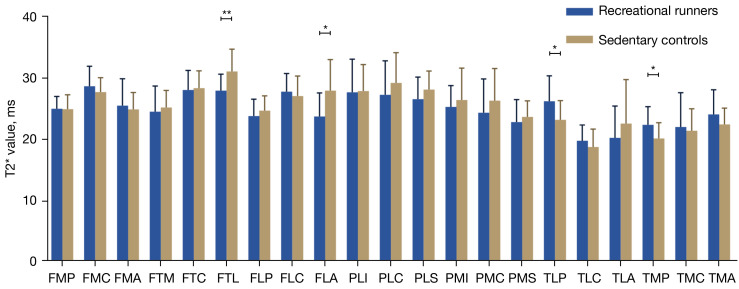
Figure 4.
Comparison of knee cartilage T2* values in 21 subregions between recreational runners and sedentary participants. *, P<0.05; **, P<0.01. FMP, femoral medial posterior; FMC, femoral medial central; FMA, femoral medial anterior; FTM, femoral trochlear medial; FTC, femoral trochlear central; FTL, femoral trochlear lateral; FLP, femoral lateral posterior; FLC, femoral lateral central; FLA, femoral lateral anterior; PLI, patellar lateral inferior; PLC, patellar lateral central; PLS, patellar lateral superior; PMI, patellar medial inferior; PMC, patellar medial central; PMS, patellar medial superior; TLP, tibial lateral posterior; TLC, tibial lateral central; TLA, tibial lateral anterior; TMP, tibial medial posterior; TMC, tibial medial central; TMA, tibial medial anterior.

