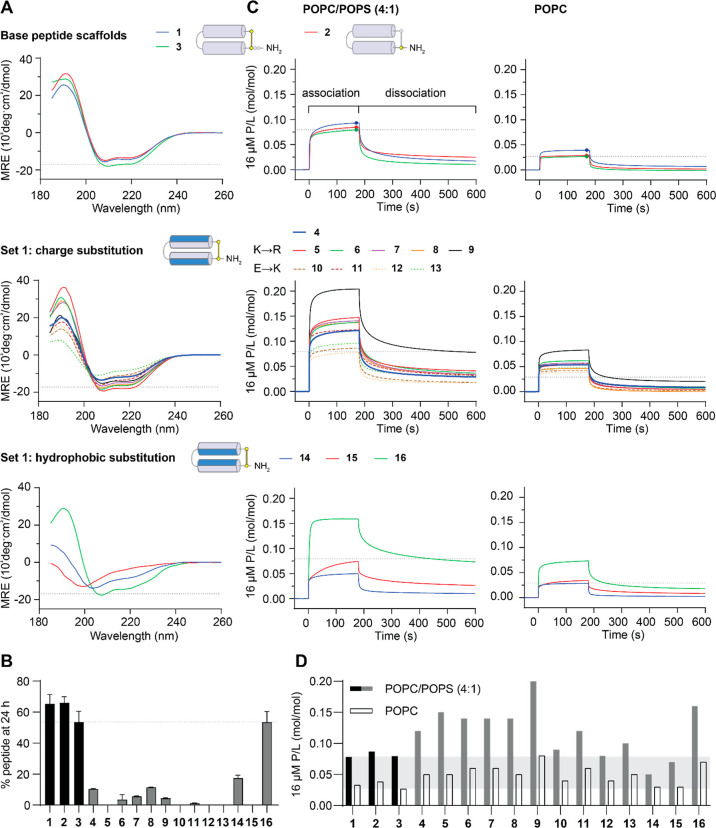
Figure 4.
Characteristics of PDIP Base Peptides and Set 1 Analogues. (A) CD spectra were collected for 50 μM peptides in aqueous solution (100 mM NaF, 10 mM KH2PO4 pH 7.5). Peptides with spectral minima at 208 and 222 nm have an overall helical structure. The MRE at 222 nm was used to calculate percentage helicity (Table 1). (B) Resistance to breakdown by serum proteases was determined from the amount of peptide remaining after 24 h of incubation with 25% (v/v) human serum. Peptides were quantified relative to time zero samples from area under the curve of intact mass m/z peaks using TOF-MS. (C) Peptide–lipid binding was compared using surface plasmon resonance (SPR) sensorgrams collected for 16 μM peptides binding to POPC/POPS (4:1) and POPC lipid bilayers. Response units (RU) were converted to P/L using (RUpeptide/mwpeptide)/(RUlipid/mwlipid). P/L at the end of the association phase (170 s) was used for comparing the peptide–lipid binding affinity for POPC/POPS (4:1) compared to that of POPC membranes in (D) (Table 1). Dashed lines or shaded regions provide a comparison to peptide 3 in each of the plots. Structure cartoons show the location of substitutions (in blue) relative to the parent scaffold.

