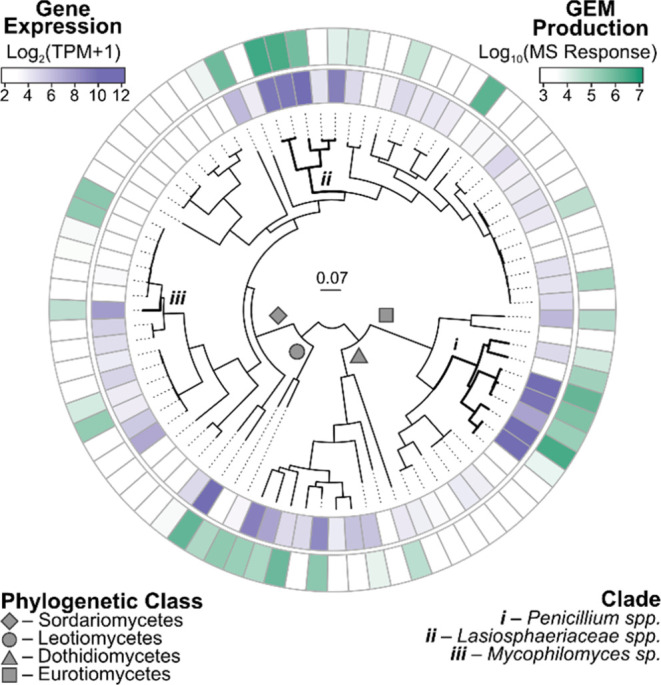
Figure 4.

Heatmap of the sum of LC-MS/MS response from targeted detection of 1 and 2 (green) and the average expression of ros cluster genes (purple), as determined by quantitative RNAseq, in fermentations of LifeBase strains containing the ros BGC. Plotted values are the maximum observed in fermentations on 7 different media conditions at days 7 and 14. The heatmap is organized by multilocus phylogenetic analysis of 100 fungal housekeeping proteins.
