
Fig. 2 |. JADE1 recruits HBO1 to the nucleosome.
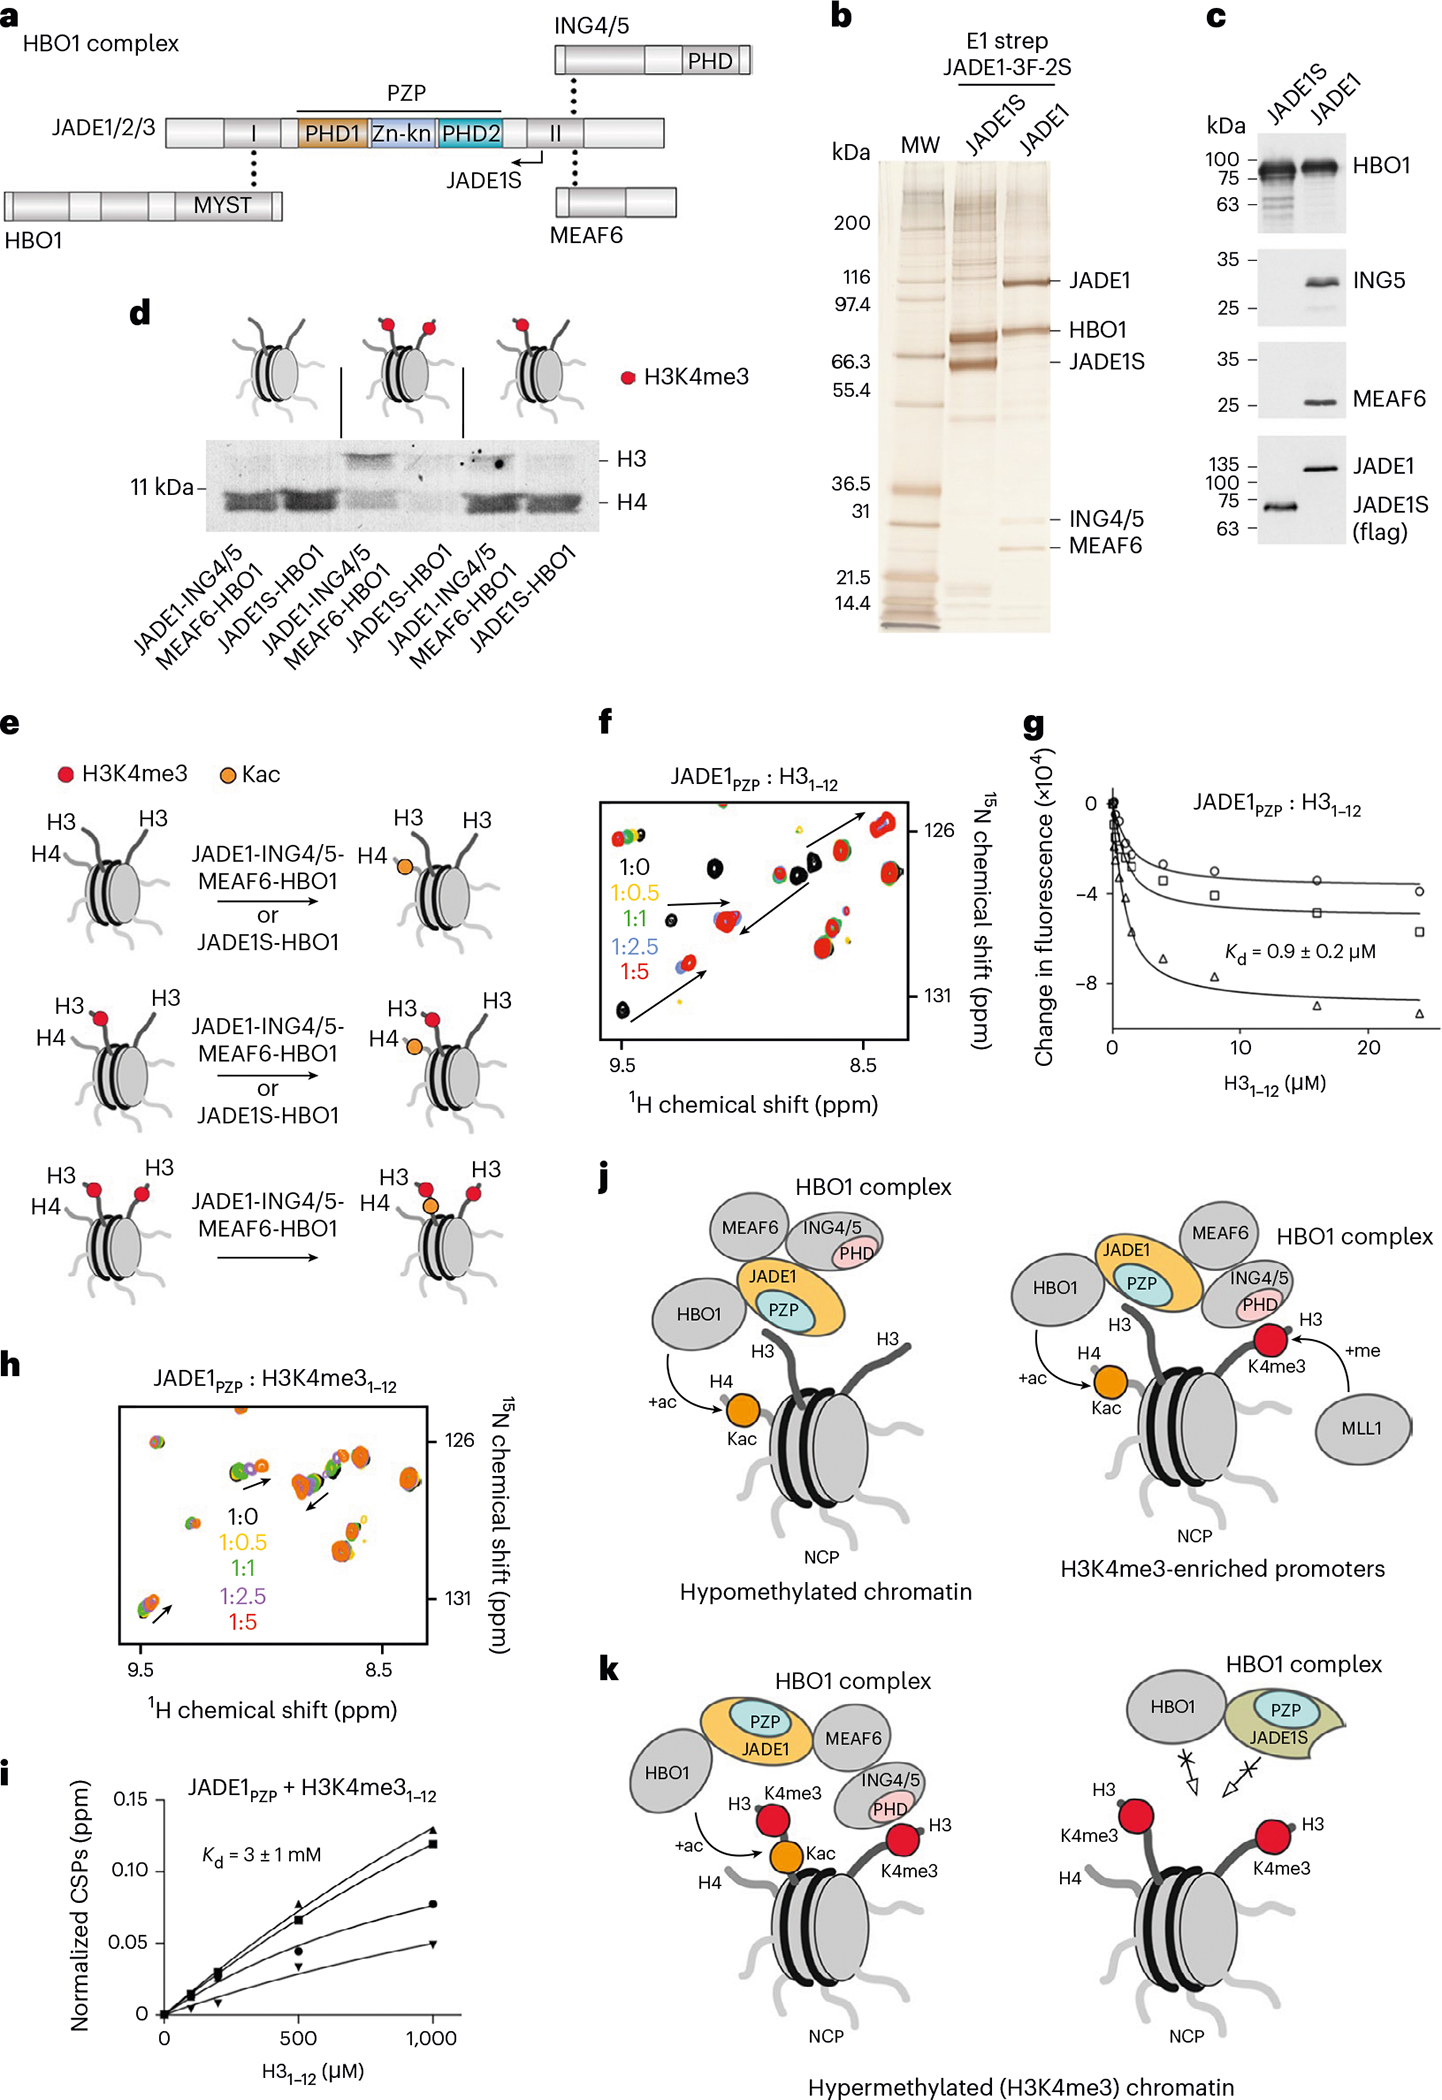
a, Schematic of HBO1 complex subunits with dot lines indicating contacts between subunits. The catalytic MYST domain and histone-binding zinc finger domains are labeled. The naturally occurring splice variant JADE1S is indicated by an arrow. b, JADE1 and JADE1S proteins were stably expressed as 3Flag-2Strep tagged versions from the AAVS1 safe harbor locus in K562 cells and purified from soluble nuclear extracts by tandem affinity chromatography. Silver-stained SDS–PAGE of biotin-eluted fractions is shown with associated protein bands labeled. c, Western blot of the purified JADE1- and JADE1S-containing HBO1 complexes with proteins detected by indicated antibodies. d, HAT assays using the purified HBO1 complexes from b and c with recombinant NCPs unmodified, carrying one (asymmetric) or two (symmetric) H3K4me3 tails (red dots). e, Cartoon summarizing results in d. Kac, acetylated lysine. f, Overlay of 1H,15N HSQC spectra of JADE1PZP in the presence of increasing amounts of H31–12 peptide. Spectra are colored according to the protein:peptide molar ratio. g, Binding curves used to determine by tryptophan fluorescence. is represented as average ± s.d. from three independent experiments (n = 3). h, Overlay of 1H,15N HSQC spectra of JADE1PZP in the presence of increasing amounts of H3K4me31–12 peptide. Spectra are colored according to the protein:peptide molar ratio. i, Binding curves used to determine by NMR. values are represented as average ± s.d. from four signals. j,k, Models of the chromatin association mechanism and function of the JADE1–HBO1 complexes.