
Fig. 3:
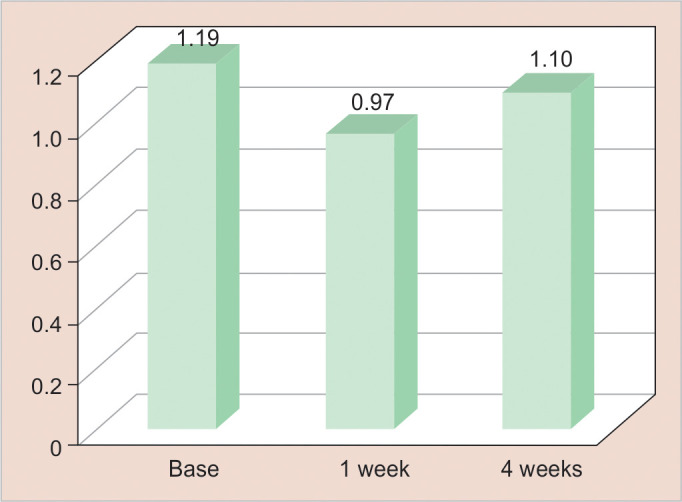
Comparison of GI at baseline, 1 week, and 4 weeks of postusage of SF of the total participants using paired t-test. Statistical significant at p ≤ 0.05
Official websites use .gov
A
.gov website belongs to an official
government organization in the United States.
Secure .gov websites use HTTPS
A lock (
) or https:// means you've safely
connected to the .gov website. Share sensitive
information only on official, secure websites.
Comparison of GI at baseline, 1 week, and 4 weeks of postusage of SF of the total participants using paired t-test. Statistical significant at p ≤ 0.05