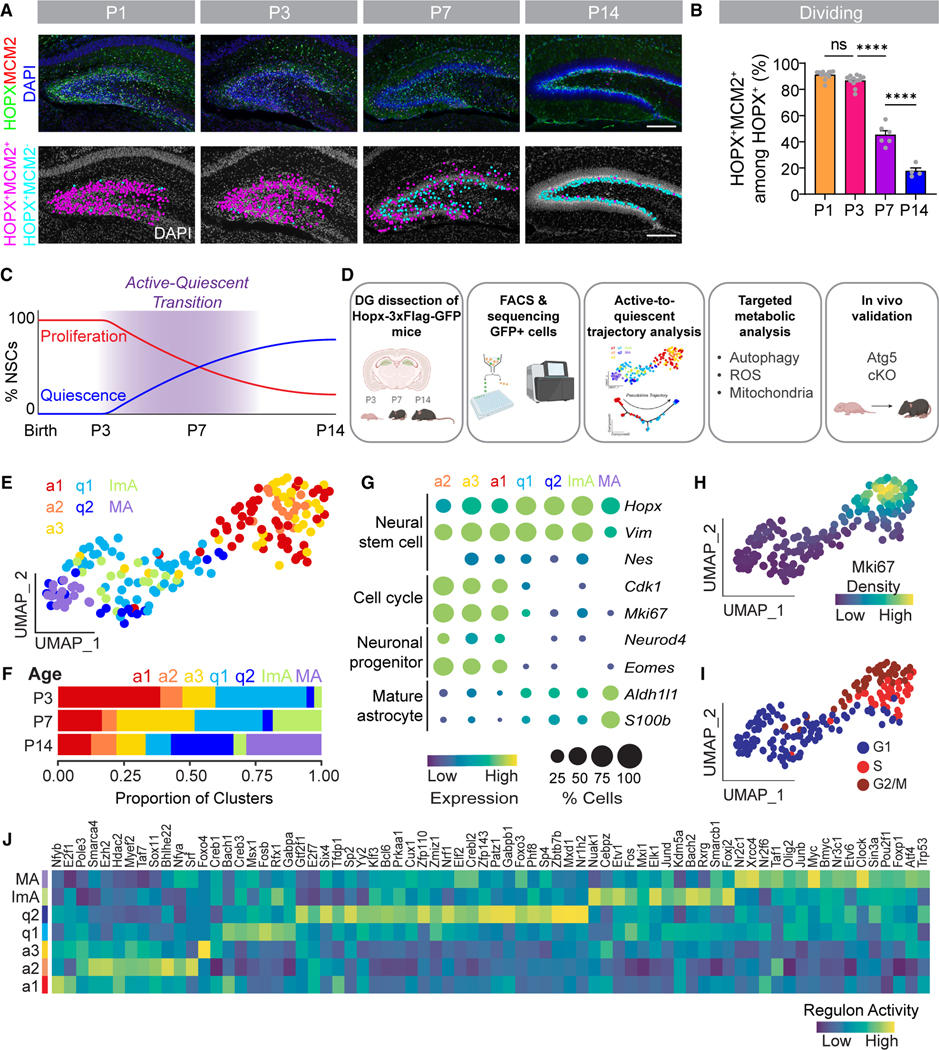
Figure 1. Single-cell RNA-sequencing reveals transcriptomic states of NSCs during the transition to a quiescent adult state.
(A) Sample confocal images of HOPX+MCM2+ dentate gyrus (DG) NSCs at P1, P3, P7, and P14 from Hopx-3xFlag-GFP mice (top panels) and corresponding diagrams of dividing HOPX+MCM2+ NSCs (pink dots) and non-dividing HOPX+ MCM2− NSCs (blue dots). Scale bars, 200 μm.
(B) Quantification of the percentage of MCM2+ cells among all HOPX+ NSCs in the DG. Each dot represents data from one mouse. Values represent mean ± SEM (n = 4–12 mice; ****p < 0.0001; ns: p > 0.05; one-way ANOVA with Tukey’s post hoc test).
(C) Timeline of the DG NSC transition from an active to quiescent state across early postnatal development (postnatal day 3 [P3], P7, and P14).
(D) GFP+ cells were isolated from the DG of Hopx-3xFlag-GFP mice at P3, P7, and P14 for single-cell RNA-sequencing (scRNA-seq; Figures 1, 2, 3, and 4), which informed a targeted metabolic analysis (Figure 5) and an in vivo functional assay to validate autophagy as a regulator of NSC development (Figure 6).
(E) UMAP of all cells (excluding ependymal cells) analyzed by scRNA-seq in (D) separated into 7 clusters (a1, active-1; a2, active-2; a3, active-3; q1, quiescent-1; q2, quiescent-2; ImA, immature astrocyte; MA, mature astrocyte) based on unsupervised Monocle2 clustering and supervised identification of a mature astrocyte cluster.
(F) Bar graph of the distribution of cells in each cluster at different ages.
(G) Bubble plot of sample cell-type-specific marker gene expression in each cluster.
(H) Kernel density estimation plot showing the distribution of Mki67 in each cell on the UMAP (E).
(I) Predicted cell cycle phase (G1, S, and G2/M) in each cell on the UMAP (E).
(J) Heatmap of regulon activity in each cluster calculated by gene regulatory network (GRN) analysis.
See also Figure S1.

